Statıstıcs II (ENG) - Tüm Sorular
Ünite 1
Soru 1
Population of country A is 500.000, population of males is 240.000 (25 % are students), population of females is 260.000 (30 % are students). How many people are there in the target population for a survey to determine sports habits of students?
Seçenekler
A
260.000
B
240.000
C
138.000
D
78.000
E
60.000
Açıklama:
x = 240.000 . 0.25 + 260.000 . 0.30 = 138.000. pg. 3. Correct answer is C.
Soru 2
Population of university A is 20000, population of engineering students is 5000 (25 % take statistics course), population of psychology students is 400 (25 % take statistics course), population of statistics students is 400. How many people are there in the target population for a survey about statistics courses?
Seçenekler
A
5800
B
5400
C
1750
D
1350
E
400
Açıklama:
x = 5.000 . 0.25 + 400 . 0.25 + 400 = 1750 . pg. 3. Correct answer is C.
Soru 3
Population of statistics students is 500, population of statistics 201 course is 150 (40 are repeating only this), population of statistics 203 course is 160 (55 are repeating only this), population of statistics 305 course is 140 (35 are repeating only this). How many people are there in the target population for a survey about repeating 2nd year courses?
Seçenekler
A
40
B
55
C
75
D
95
E
310
Açıklama:
x = 40 + 55 = 95. pg. 3. Correct answer is D.
Soru 4
In a research, 5 of 20 schools of university A were selected at random. 2 classes of each of the 5 schools were chosen at random. Then, 3 courses were selected from each class at random. Which type of sampling methods was used in this research?
Seçenekler
A
convenience
B
multi stage
C
simple random
D
stratified
E
systematic
Açıklama:
An extension of cluster sampling in which clusters are selected and a sample is drawn from the cluster members by simple random sampling is called multistage sampling. pg. 12. Correct answer is B.
Soru 5
The titles of term projects for psychology course were written separetely on pieces of papers then placed in a black box. Then, student A selected 2 papers from the box. Which type of sampling methods was used in this sampling ?
Seçenekler
A
stratified
B
snow ball
C
systematic
D
simple random
E
cluster
Açıklama:
The simple random sample from a population is a sample that is selected so that each possible sample combination of the specified size has equal probability of being chosen. In practice, a simple random sample is usually called random sample.. pg. 7 . Correct answer is D.
Soru 6
Systematic sampling : sample size is 1024, number of members in the population is 16, random starting point is 257. What is the order of the 3rd sample point?
Seçenekler
A
225th
B
289th
C
514th
D
771th
E
787th
Açıklama:
x = 257 + 2 . 16 = 289. pg. 12. Correct answer is B.
Soru 7
In Eskisehir, 10 students were selected randomly from each of 3 universities to participate in a survey. Which type of sampling method was used?
Seçenekler
A
systematic
B
multi stage
C
cluster
D
stratified
E
simple random
Açıklama:
In stratified sampling method, the target population is divided into homogenous subgroups which are called strata. Each subgroup is called stratum. Then a probability sampling method such as simple random sampling method is applied for each stratum to take a sample from the population. The strata must be mutually exclusive and exhaustive. This means that each unit of the population must be assigned to only one stratum. pg. 9. Correct answer is D.
Soru 8
In a market, a chef selects the first 5 vegetables he sees in the fresh vegetable boxes as her test samples. Which type of sampling method does the chef use?
Seçenekler
A
systematic
B
convenience
C
quota
D
stratified
E
snowball
Açıklama:
A convenience sample involves a group of individuals that is ready and available. It is also called availability sampling method. pg. 13. Correct answer is B.
Soru 9
A linguist interviews with speakers of a rare languge A. She selects a few speakers to start with and at the end of interview he asks if the participant knows any other speakers that might want to participate. Which type of sampling method does the manager use?
Seçenekler
A
convenience
B
quota
C
snow ball
D
multi stage
E
cluster
Açıklama:
In snowball sampling, the members, who are identified previously, are asked to identify other members of the population. pg. 13. Correct answer is C.
Soru 10
In a university, a surveyor calculated the proportion of girls as 30 % and 34 % at ages 20 and 21, and proportion of boys are 26 % and 10 % of the boys at ages 20 and 21, respectively. What is the sampling method she used ?
Seçenekler
A
convenience
B
simple random
C
snow ball
D
quota
E
multi stage
Açıklama:
In quota sampling, the population is divided into subgroups being studied, such as male and female, younger and older, engineer, doctor and lawyer. Then, the proportion of the members who fall into each subgroup is estimated. Finally, the sample reflecting the estimated proportions is drawn from the population. It is a non-probabilistic version of stratified sampling method. pg. 13. Correct answer is D.
Soru 11
If someone wants to carry out a research to find out the smoking rate in females over the age of 50 living in Eskişehir, what is the target population for this research?
Seçenekler
A
Instructors at Anadolu University
B
Females in Eskişehir
C
People over 50 in Eskişehir
D
Females over 50 in Turkey
E
Females over 50 in Eskişehir
Açıklama:
If the researcher wants find the rate of smoking in females over 50 years of age in Eskişehir, the target population should be females over the age of 50 in Eskişehir. The correct answer is E.
Soru 12
Which one of the following is not a reason of sampling?
Seçenekler
A
Cost
B
Time
C
Accuracy
D
Inequality
E
Physical impossibility
Açıklama:
Reasons of sampling are cost, time, accuracy, physical impossibility, and destructive tests. The correct answer is D.
Soru 13
I. Random numbers can be used to select simple random samples from a population frame.
II. Each possible sample combination of the specified size does not have equal probability of being chosen.
III. It is the most basic sampling method.
Which of the given is TRUE about simple random sampling?
II. Each possible sample combination of the specified size does not have equal probability of being chosen.
III. It is the most basic sampling method.
Which of the given is TRUE about simple random sampling?
Seçenekler
A
Only I
B
I & II
C
I & III
D
II & III
E
I, II & III
Açıklama:
The most basic sampling method is the simple random sampling. The simple random sample from a population is a sample that is selected so that each possible sample combination of the specified size has equal probability of being chosen. In practice, a simple random sample is usually called random sample. Random numbers are often used to select simple random samples from a population frame. The correct answer is C.
Soru 14
Which one of the following is not a probability sampling method?
Seçenekler
A
Simple random sampling
B
Convenience sampling
C
Stratified sampling
D
Cluster sampling
E
Systematic sampling
Açıklama:
Probability sampling methods are simple random sampling, stratified sampling, cluster sampling, and systematic sampling. The correct answer is B.
Soru 15
Which one of the following method's most important feature is efficiency?
Seçenekler
A
Stratified sampling
B
Snowball sampling
C
Convenience sampling
D
Quota sampling
E
Cluster sampling
Açıklama:
Stratified sampling has some advantages. The most important feature is efficiency. Stratified sample is much more efficient than a simple random sample. The correct answer is A.
Soru 16
Multistage sampling is an extension of _______
Seçenekler
A
Simple random sampling
B
Stratified sampling
C
Quota sampling
D
Systematic sampling
E
Cluster sampling
Açıklama:
An extension of cluster sampling in which clusters are selected and a sample is drawn from the cluster members by simple random sampling is called multistage sampling. The correct answer is E.
Soru 17
In _______, every kth element after a random starting point is taken.
Seçenekler
A
Snowball sampling
B
Quota sampling
C
Convenience sampling
D
Systematic sampling
E
Simple random sampling
Açıklama:
Systematic sampling method is applied easily by taking every kth element after a random starting point. The correct answer is D.
Soru 18
Which one of the following is a nonprobability sampling method?
Seçenekler
A
Simple random sampling
B
Stratified sampling
C
Snowball sampling
D
Cluster sampling
E
Systematic sampling
Açıklama:
Nonprobability sampling methods are convenience sampling, snowball sampling, and quota sampling. The correct answer is C.
Soru 19
Which one of the following is also called availability sampling method?
Seçenekler
A
Snowball sampling
B
Convenience sampling
C
Quota sampling
D
Systematic sampling
E
Stratified sampling
Açıklama:
A convenience sample involves a group of individuals that is ready and available. It is also called availability sampling method. The correct answer is B.
Soru 20
A researcher wants to collect data about drug users and knows a few of them. The researcher asks identified subjects to recruit other members and this process is repeated until the determined sample size is achieved. This researcher uses _______.
Seçenekler
A
Snowball sampling
B
Systematic sampling
C
Quota sampling
D
Convenience sampling
E
Cluster sampling
Açıklama:
Two main steps are applied in snowball sampling method. The potential members in the population are identified. Then, some of the members are selected initially. The identified subjects are asked to recruit other members and then those people are asked to recruit, and so on. However, the selected participants should be made aware that they do not have to provide any other members. The above steps are repeated until the determined sample size is achieved. Ethically, the identified members should not be forced to give other members. Rather, the previously identified members should be asked to encourage others to participate. The correct answer is A.
Soru 21
I. A population should be finite
II. Sometimes sample may be bigger than population
III. Using a proper sample surveyors may make very accurate prediction
Which one(s) of the above is/are true?
II. Sometimes sample may be bigger than population
III. Using a proper sample surveyors may make very accurate prediction
Which one(s) of the above is/are true?
Seçenekler
A
I, II
B
II, III
C
I, III
D
I
E
III
Açıklama:
A population can be infinite, sample can't be bigger than population, using a proper sample surveyors may make very accurate prediction.
Soru 22
In a factory there are 10,000 workers. %70 of workers are male. If we make a random sample of 200 proportional to the gender, how many of sample points should be female?
Seçenekler
A
30
B
60
C
70
D
90
E
140
Açıklama:
A representative sample includes similar distribution of important characteristics. %30 of the population are female so the ratio should be same for the sample. %30 of 200 is 60.
Soru 23
Which one of the following investigations must definitely use sampling?
Seçenekler
A
Census
B
Celiac rate among the population
C
Safety test of cars
D
The overall Average height of students in a high school
E
Total water consumption in Eskişehir
Açıklama:
Safety test of cars must definitely use sample because it is a destructive test. While other research can use sample in order to gain time, money etc.
Soru 24
Consider a sample of five firms from a population of 20 firms. If the sampling procedure gives each combination an equal probability, how many different samples are there?
Seçenekler
A
5040
B
15504
C
40320
D
362880
E
3628800
Açıklama:
The selection procedure has the fact that 20! / [5! × (20-5)! ] = 15,504 different combinations of five firms that can be drawn from a population of 20 firms.
Soru 25
The population consist of five cities denoted by A, B, C, D, and E. If a sample of two cities is to be selected from this population how many different samples can be created?
Seçenekler
A
5
B
10
C
15
D
25
E
125
Açıklama:
There are 10 different samples that can be created.
Soru 26
The researcher intends to separate the patients according to their grade of the cancer (grade I, II, III, and IV), age (20-30, 40-59, 60-89 years) and the monthly income (less than 2500TL, 2500TL-5000TL, 5000TL and more.) How many stratum are there?
Seçenekler
A
3
B
10
C
14
D
36
E
72
Açıklama:
4x3x3 = 36. The population can be divided into 36 stratum.
Soru 27
A survey was conducted on parents’ of 1000 students from 50 schools chosen by a cluster sampling method from among the public, private, and technical high schools in a city. The researchers visited the schools and selected students by using a list of random numbers based on the school’s size.
Which method of sampling is described above?
Which method of sampling is described above?
Seçenekler
A
Simple Random Sampling
B
Stratified Sampling
C
Snowball Sampling
D
Quota Sampling
E
Two-stage sampling
Açıklama:
If only a sample of members taken from the clusters are included in the sample, the sampling method is two-stage sampling.
Soru 28
Which one of the following is a non-probability sampling method?
Seçenekler
A
Systematic Sampling
B
Cluster Sampling
C
Stratified Sampling
D
Simple Random Sampling
E
Snowball Sampling
Açıklama:
Snowball Sampling is a nonprobability sampling method.
Soru 29
The members, who are identified previously, are asked to identify other members of the population. Newly identified members name others.
Which method of sampling is described above?
Which method of sampling is described above?
Seçenekler
A
Convenience Sampling
B
Snowball Sampling
C
Quota Sampling
D
Random Sampling
E
Cluster Sampling
Açıklama:
As newly identified members name others, the sample is getting larger as snowballs. Snowball sampling technique is used when listing of population is not available and cannot be compiled.
Soru 30
I. Simple Random Sampling
II. Stratified Sampling
III.Convenience Sampling
IV. Quota Sampling
In which of the method(s) above target population is divided into subgroups?
II. Stratified Sampling
III.Convenience Sampling
IV. Quota Sampling
In which of the method(s) above target population is divided into subgroups?
Seçenekler
A
I, II
B
I, III
C
II, III
D
II, IV
E
IV
Açıklama:
In Quota sampling and Stratified sampling the population is divided into subgroups.
Soru 31
A survey to search out the preferences of teenagers in Istanbul about novel selection was conducted accordingly: 80 girls and 80 boys, aged between 14-18, were asked the same questions such as the last novel they read, etc. For the design of the study, which is a wrong statement?
Seçenekler
A
Target population is the teenagers in Istanbul
B
80 girls and 80 boys, aged between 14-18 are the sample
C
Sample reflects the characteristics of the population in the best way possible
D
Purpose of the survey is to find out the preferances of teenagers in Istanbul about novel selection
E
Teenagers from all over the world can also be accepted as the population
Açıklama:
Target population is whom the results obtained from the sample are to be applied or generalized. Sample should reflect the characteristics of the population (teenagers) as much as possible. In the case represented in the question, gender distribution of the population was not taken into consideration and simplu thought to be half and half.
Characteristics like gender distribution should be considered while designing such a study.
Characteristics like gender distribution should be considered while designing such a study.
Soru 32
A qualitative survey was conducted to find out how contended 3rd year medical students are with distance learning instead of conventional methods in Europe. 250 students were included in the study from different European countries. Concerning statistical terminology, which of the following matching is true?
Seçenekler
A
Target population - 3rd year medical students in Europe
B
Sample - Medical students in Europe
C
Purpose - to learn the difference between distance learning and conventional methods
D
Sampling - Reflection of the results to whole population
E
Random sample - Choosing students from all grades
Açıklama:
Target population is whom the results obtained from the sample are to be applied or generalized. Population is the universe to be sampled. Sample is a part of a population which is provided by some process or other, usually by deliberate selection with the object of investigating the properties of the parent population or set (for the question, 250 students from different European countries). Purpose is to figure out how contended 3rd year medical students are with distance learning instead of conventional methods in Europe. Sampling is technique of selecting items from a population. Random sample is the sample taken from the population including the characteristics of the population as much as possible.
Target population in the question is the 3rd year medical students in Europe.
Target population in the question is the 3rd year medical students in Europe.
Soru 33
Why to use a sample instead of a census to obtain some information about the characteristics of a population?
Seçenekler
A
A census often provides reliable and useful information at much lower cost than does a sampling.
B
A sampling survey often provides more timely information than a census.
C
While a sample data is gathered, many unexpected problems may affect the accuracy of the results.
D
Some populations are uncountable or infinite to conduct a sample.
E
If a test includes the destruction of an item or product, a census should be used.
Açıklama:
A sampling survey often provides more timely information than a census, because fewer data have to be collected and analysed. Statements in the other choices are exact opposite expressions concerning survey and census.
Soru 34
Which one of the following option is a non-probability sampling method?
Seçenekler
A
Systematic Sampling
B
Cluster Sampling
C
Stratified Sampling
D
Simple Random Sampling
E
Convenience Sampling
Açıklama:
Convenience Sampling is one of the non-probability sampling methods while the methods included in the other choices are examples of probability sampling methods.
Convenience Sampling is one of the non-probability sampling methods.
Convenience Sampling is one of the non-probability sampling methods.
Soru 35
Which sampling method should be chosen when each possible sample combination of the specified size required to has equal probability of being chosen?
Seçenekler
A
Stratified Sampling
B
Cluster Sampling
C
Systematic Sampling
D
Random sample
E
Snowball Sampling
Açıklama:
With the random sample method, each possible sample combination of the specified size has equal probability of being chosen.
Random sample is the method to be chosen when each possible sample combination of the specified size required to has equal probability of being chosen.
Random sample is the method to be chosen when each possible sample combination of the specified size required to has equal probability of being chosen.
Soru 36
If you want to conduct a research to assess newspaper reading habit of people older than age 30 in a particular village, and want to discuss the results according to gender, socioeconomic status (regarding the income less and more than a predetermined amount) and being a university-graduate or not, which sampling method will be the best choice?
Seçenekler
A
Stratified Sampling
B
Using Random Numbers for Sample Selection
C
Cluster Sampling
D
Systematic Sampling
E
Snowball Sampling
Açıklama:
In stratified sampling method, the target population is divided into homogenous subgroups. Subgroups should be determined based on available characteristics that they are related to the outcome of the survey or research. When a population can be clearly divided into homogenous groups based on some characteristic, we can use stratified random sampling.
If the study design includes subgroups, stratified sampling method should be chosen.
If the study design includes subgroups, stratified sampling method should be chosen.
Soru 37
Which sampling method relies on naturally occurring group of units in the population?
Seçenekler
A
Simple Random Sampling
B
Using Random Numbers for Sample Selection
C
Stratified Sampling
D
Cluster Sampling
E
Systematic Sampling
Açıklama:
A cluster is a naturally occurring group of units in the population. Cluster sampling method differs from other sampling methods in that the clusters naturally occur in a population.
Cluster sampling method relies on naturally occurring group of units in the population.
Cluster sampling method relies on naturally occurring group of units in the population.
Soru 38
Which sampling method provides observation of habits, opinions, and viewpoints in the easiest possible manner?
Seçenekler
A
Systematic Sampling
B
Convenience Sampling
C
Cluster Sampling
D
Snowball Sampling
E
Quota Sampling
Açıklama:
A convenience sample involves a group of individuals that is ready and available. The surveyors select members merely on the basis of proximity and does not consider whether they represent the entire population or not. By using this sampling techniques, we can observe habits, opinions, and viewpoints in the easiest possible manner.
Convenience Sampling provides observation of habits, opinions, and viewpoints in the easiest possible manner.
Convenience Sampling provides observation of habits, opinions, and viewpoints in the easiest possible manner.
Soru 39
In a social experiment about drug abuse in young population, researchers have difficulities to list the population, even to reach them. Which sampling method should they use for the research?
Seçenekler
A
Snowball Sampling
B
Quota Sampling
C
Convenience Sampling
D
Cluster Sampling
E
Stratified Sampling
Açıklama:
Snowball sampling technique is used when listing of population is not available and cannot be compiled. The identified subjects are asked to recruit other members and then those people are asked to recruit, and so on.
Soru 40
If a research team have a suspicion that sampling may lead to a bias, which sampling method is most likely the one used in the study?
Seçenekler
A
Stratified Sampling
B
Cluster Sampling
C
Snowball Sampling
D
Quota sampling
E
Convenience Sampling
Açıklama:
In Snowball Sampling, an unbiased sample may not be obtained because of recommendations.
In the study design mentioned in the question, the concern comes from the Snowball Sampling.
In the study design mentioned in the question, the concern comes from the Snowball Sampling.
Soru 41
Which of the following is not one of the reasons for sampling from a population?
Seçenekler
A
Testing of a unit may be too expensive and testing the whole population may exceed the limit of the fund allocated
B
Measuring time may be too long to measure all the units in the population and a complete measurement takes for ages
C
A full inspection of the aggregate data may be troublesome while a good sample reflects the population with less effort
D
Reaching all the population is sometimes impossible and most of the researches do not require a complete set
E
Using a manipulated sample makes it easier to create a fake population that does not reflect the facts of reality
Açıklama:
The reasons for sampling from a population are
- the limitations on costs and time,
- physical impossibilities of reaching all the members of a population,
- the accuracy problems of complete testing, and
- some tests being destructive.
On the other hand, faking the facts of a population can not be the reason why the sampling is needed.
- the limitations on costs and time,
- physical impossibilities of reaching all the members of a population,
- the accuracy problems of complete testing, and
- some tests being destructive.
On the other hand, faking the facts of a population can not be the reason why the sampling is needed.
Soru 42
if you want to take a random sample from the population, what should be done for an accurate sample?
Seçenekler
A
Including the characteristics of the population as much as possible
B
Taking the samples that can be reached easily
C
Ignoring some of the characteristics that makes it harder to sample
D
Being quick to get the testing phase as soon as possible
E
Spending less effort while sampling and saving it to the analysis
Açıklama:
if you want to take a random sample from a population, you would like to include the characteristics of the population in your sample as much as possible. Alternative B, C, D and E are the DO NOTs of the sampling process.
Soru 43
A researcher wants to conduct a survey to determine the infertility rate in females over 30 years of age living in Turkey. Which of the following is the true target population for this research?
Seçenekler
A
All females over 30 age of years living in Ankara
B
All females living in Turkey
C
All people living in Turkey
D
All females over 30 age of years living in Turkey
E
All people over 30 age of years living in Turkey
Açıklama:
"All females over 30 age of years living in Turkey" is the true target population for the research given in the question.
Soru 44
Which of the following is correct about the sampling process?
Seçenekler
A
Sample must be the census of the population
B
Sampling size can not be over 1% of the population
C
Sample must include all members of the population
D
Sample must include at most half of members of the population
E
Sample must represent or model of the population
Açıklama:
In the sampling process, the sample taken must represent or model of the population.
Soru 45
In stratified sampling method, the target population is synthetically divided into homogenous subgroups based on some characteristics. Which of the following is the correct term for these homogeneous subgroups?
Seçenekler
A
Stratum
B
Frame
C
Strasse
D
Strata
E
Stripe
Açıklama:
In stratified sampling method, the target population is divided into homogenous subgroups which are called strata. Each subgroup is called stratum. Alternatives other than strata and stratum are irrelevant to the question, and the plural term for the subgroups "strata" is the correct term for the question.
Soru 46
What is the difference between stratified and cluster sampling?
Seçenekler
A
In stratified sampling groups characteristics designed by the researcher while in the clustering they occur naturally
B
Stratified sampling is a random sampling method while clustered sampling is a non-probability sampling method
C
Stratified sampling method is always more accurate than clustered sampling
D
Clustering method requires subgroup segmentation by the researcher, while stratified sampling does not
E
Cluster sampling is more efficient than simple random sampling, while the stratified sampling is not
Açıklama:
Clustered sampling differs from the stratified sampling method in the way that the clusters occur naturally. In stratified sampling groups characteristics designed by the researcher.
Soru 47
A researcher decides to use systematic sampling. The population to be researched has a member of 3.380 and the sample size is 65 units. If the researcher starts sampling form the 15th unit, which of the following is one of the units to be sampled?
Seçenekler
A
52
B
65
C
80
D
119
E
277
Açıklama:
k= 3.380 / 65 = 52. Starting from the 15th, units to be sampled are (15 + k, 15 + 2k, ...)
67, 119, 171, 223, 275, 327th units of the population and so on...
67, 119, 171, 223, 275, 327th units of the population and so on...
Soru 48
I. Quota Sampling
II. Cluster Sampling
III. Stratified Sampling
Which of the above is (or are) considered as non-probability sampling?
II. Cluster Sampling
III. Stratified Sampling
Which of the above is (or are) considered as non-probability sampling?
Seçenekler
A
Only I
B
Only II
C
I and II
D
I and III
E
II and III
Açıklama:
The only non-probability sampling method is the quota sampling among given ones in the question.
Soru 49
Which of the following is the sampling method based on identifying the samples by the former samples selected?
Seçenekler
A
Quota sampling
B
Convenience sampling
C
Cluster sampling
D
Snowball sampling
E
Stratified sampling
Açıklama:
Snowball sampling method is the sampling method based on identifying the samples by the former samples selected. In snowball sampling, the members, who are identified previously, are asked to identify other members of the population. As newly identified members name others, the sample is getting larger as snowballs.
Soru 50
"If all the members in selected clusters are included in the sample, the method is called ______________. If only a sample of members taken from the clusters are included in the sample, the sampling method is ______________."
Which of the following correctly completes the blanks with the right order?
Which of the following correctly completes the blanks with the right order?
Seçenekler
A
cluster sampling - stratified sampling
B
cluster sampling - two-stage sampling
C
two-stage sampling - cluster sampling
D
stratified sampling - cluster sampling
E
cluster sampling - convenience sampling
Açıklama:
if all the members in selected clusters are included in the sample, the method is called cluster sampling. If only a sample of members taken from the clusters are included in the sample, the sampling method is two-stage sampling. The correct answer is "cluster sampling - two-stage sampling " which is given in the alternative B
Soru 51
___________________ is the universe to be sampled, such as all Turkish people, all universities in Turkey, all pregnant women over 40 years of age, all adult males who smoke 20 cigarettes or more daily, or all the buildings in Eskişehir, Turkey?
Seçenekler
A
Sample
B
Parameter
C
Statistics
D
Population
E
Database
Açıklama:
A population is the universe to be sampled, such as all Turkish people, all universities in Turkey, all pregnant women over 40 years of age, all adult males who smoke 20 cigarettes or more daily, or all the buildings in Eskişehir, Turkey.
Soru 52
Population can be finite or ___________ ?
Seçenekler
A
Parameter
B
Infinite
C
Restricted to 500
D
Smaller than 1250
E
Bigger than 100
Açıklama:
Population can be finite or infinite.
Soru 53
___ _____________________ includes similar distribution of important characteristics (e.g., age, gender, marital status, health status) with the distributions of those characteristics in the population?
Seçenekler
A
A bad
B
A representative sample
C
An area
D
An average
E
Standard deviation
Açıklama:
A representative sample includes similar distribution of important characteristics (e.g., age, gender, marital status, health status) with the distributions of those characteristics in the population.
Soru 54
Which one of the following is not one of the reasons of sampling?
Seçenekler
A
Cost
B
Time
C
Average
D
Accuracy
E
Destructive tests
Açıklama:
Reasons Of Sampling
When we try to obtain some information about the characteristics of a population there are important reasons why we use a sample instead of a census. The main reasons for sampling can be categorised by the following topics:
Cost
Every project has a limited funding.
Time
A sampling survey often provides more timely information than a census, because fewer data have to be collected and analysed. Thus, the required information can be achieved quickly.
Accuracy
While a census data is gathered, many unexpected problems may affect the accuracy of the results such as recording errors, copying errors, false recordings by interviewers etc. So, while working with census data, we may inadvertently come across with a figure for a population parameter being further away than the actual value. With a good sampling procedure using good sampling methods and by choosing random observations, actually we can be very close to the true value of the population parameter.
Physical Impossibility
Some populations are uncountable or infinite to conduct a census. In this situation, it is impossible to consider all the elements of a population. Thus, a sample is necessary to obtain information from a population.
Destructive Tests
If a test includes the destruction of an item or product, sampling should be used. For example, when a car manufacturer would like to get a safety rating on their cars, they send a selection of cars (3 to 5 cars) to the safety agency for testing and these cars goes under different test including a crash which demolishes the car.
Soru 55
In which reason of sampling we consider "Some populations are uncountable or infinite to conduct a census"?
Seçenekler
A
Cost
B
Accuracy
C
Destructive tests
D
Physical Impossibility
E
Mean
Açıklama:
Physical Impossibility
Some populations are uncountable or infinite to conduct a census. In this situation, it is impossible to consider all the elements of a population. Thus, a sample is necessary to obtain information from a population. For example, an environment engineer wants to determine the Ph level of a lake. It would be impossible to take all the water in the lake. Another example is the geographical size of the area that would be covered in the survey. Think about New York City, the population density is over 27,000 people square miles. Population density of Turkmenistan is 10.5 people per square km. Whereas the population density of Turkey is 104 people per square km. Now in your spare time, look at the maps of these countries and make a comparison of the sizes of these countries then you may see that how difficult it could be if you want to conduct a census in Turkmenistan.
Some populations are uncountable or infinite to conduct a census. In this situation, it is impossible to consider all the elements of a population. Thus, a sample is necessary to obtain information from a population. For example, an environment engineer wants to determine the Ph level of a lake. It would be impossible to take all the water in the lake. Another example is the geographical size of the area that would be covered in the survey. Think about New York City, the population density is over 27,000 people square miles. Population density of Turkmenistan is 10.5 people per square km. Whereas the population density of Turkey is 104 people per square km. Now in your spare time, look at the maps of these countries and make a comparison of the sizes of these countries then you may see that how difficult it could be if you want to conduct a census in Turkmenistan.
Soru 56
If you can assign a probability to each object in the population to be selected in to a sample, what kind of sampling is used?
Seçenekler
A
Non-probability sampling
B
Convenience sampling
C
Probability Sampling
D
Snowball sampling
E
Quota sampling
Açıklama:
Probability sampling methods provide a statistical basis for saying that a sample is representative of the target population. In probability sampling methods, every unit of the target population have a known and non-zero probability of being selected for the sample. We can say that because probability sampling methods use a random mechanism thus eliminating subjectivity in the selection of a sample, these methods are an unbiased way of creating a sample.
Soru 57
If there are 120 objects in a population and the investigator wants to use simple random sampling to choose objects in to a sample from this population, what is the probability of a object to be selected in to a sample?
Seçenekler
A
120/4
B
120/10
C
1/100
D
1/120
E
1/100
Açıklama:
any types of probability samples are available for sampling from a population. The most basic sampling method is the simple random sampling. The simple random sample from a population is a sample that is selected so that each possible sample combination of the specified size has equal probability of being chosen. In practice, a simple random sample is usually called random sample.
- Select the first sample element by giving each of the N population elements an equal probability (1/N) of being chosen.
Soru 58
There are 40 observations in a population. A sample of 4 observations are to be selected randomly using a table of random numbers. Here are the the random numbers obtained from the table of random numbers: 55, 34, 67, 89, 12, 23, 89, 78, 18, 99, 92, 16, 45, and 10. In which random number given in this list, the process of selecting sample should be stopped?
Seçenekler
A
67
B
78
C
92
D
16
E
18
Açıklama:
The last sample observation (4th observation) is found at the value of 18. The numbers bigger than 40 are disregarded therefore the answer is 18.
Soru 59
In stratified sampling method, the target population is divided into homogenous subgroups which are called _________________ ?
Seçenekler
A
A data value
B
Strata
C
Sampling
D
Stratum
E
Population
Açıklama:
In stratified sampling method, the target population is divided into homogenous subgroups which are called strata?
Soru 60
What is also called availability sampling method?
Seçenekler
A
Snowball Sampling
B
Quota Sampling
C
Simple random
D
Stratified
E
Convenience Sampling
Açıklama:
Convenience Sampling
A convenience sample involves a group of individuals that is ready and available. It is also called availability sampling method. A convenience sampling is used to create sample as per ease of access, readiness to be a part of the sample, availability at a given time period or any other specifications of a particular element. The surveyors select members merely on the basis of proximity and does not consider whether they represent the entire population or not. By using this sampling techniques, we can observe habits, opinions, and viewpoints in the easiest possible manner.
Many researchers prefer convenience sampling method because it is inexpensive, easy and applied quickly. Because of the potential for bias in the sampling method, the results obtained from this sampling method should be reported and used with a great caution.
Soru 61
A researcher wants to conduct a survey on the mathematics scores of the Turkish students in Turkey. Which of the following can not belong to the sample choosen for this survey?
Seçenekler
A
Ali; a 11 years old student living in İstanbul.
B
Ahmet; a 15 years old student living in Kızılcahamam.
C
Aysun; a 10 years old student living in Berlin.
D
Mehmet; a 8 years old student living in Eskişehir.
E
Nazlı; a 12 years old student living in Mardin.
Açıklama:
Since Aysun lives in Germany, she doesn't belong to the target population although she is Turkish.
Soru 62
Which of the following is true about the population?
Seçenekler
A
Populations are always homogenous.
B
Populations are always finite.
C
The size of the population is smaller than the sample.
D
Populations always contain more than 1000 items.
E
Populations can contain any type of objects.
Açıklama:
Populations can be heterogenous or infinite. So arguments in A and B are not true. Population size is larger than the sample, so C is false also. There is no restriction on population size, so D is false. However, populatios can contain any type of objects. So E is true.
Soru 63
Which of the following are among the reasons for sampling?
- Cost
- Time
- Accuracy
- Destructive tests
- Esthetics
Seçenekler
A
II, III, IV and V
B
I, III, IV and V
C
I, II, IV and V
D
I, II, III and IV
E
I, II, III and V
Açıklama:
Esthetics is not a reason for sampling.
Soru 64
In which sampling methods one uses stratums?
Seçenekler
A
Simple random sampling
B
Stratified sampling
C
Sampling with replacement
D
Cluster sampling
E
Systematic sampling
Açıklama:
Stratums are used in stratified sampling.
Soru 65
In which of the following sampling methods subgroups occur naturally (such as departments of a company)?
Seçenekler
A
Stratified sampling
B
Cluster sampling
C
Systematic sampling
D
Snowball sampling
E
Convenience sampling
Açıklama:
In cluster sampling the subgroups occur naturally. These subgroups are called clusters.
Soru 66
A researcher wants to compute the mean weight of a certain product produced by a firm. The firm produces 8000 products per day and each product has a serial number from 1 to 8000. The researcher decide to choose 80 products in order to compute average weight. He chooses the products with serial numbers 3, 103, 203,303, 403, 503......7903. Which method of sampling did the researcher apllied?
Seçenekler
A
Systematic sampling
B
Cluster sampling
C
Stratified sampling
D
Sampling with replacement
E
Convenience sampling
Açıklama:
He used the systematic sampling because he chooses 1 of the every 100 products in a systematic way. (8000/80=100 so he chooses the first element randomly, which is the 3rd one, and adds 100 to find the next one at each time)
Soru 67
In which sampling methods the sample includes the individiuals which are ready and availiable?
Seçenekler
A
Quota sampling
B
Snowball sampling
C
Convenience sampling
D
Cluster sampling
E
Systematic sampling
Açıklama:
A convenience sample involves a group of individuals that is ready and available. It is also called availability sampling method.
Soru 68
A reseacher wants to analyse the consumption behaviors of people in a city. He divides the population into 4 groups: male/female and young/old. Then he estimates the proportion of each group in population and constructs the samples accordingly. So, which sampling method does he uses?
Seçenekler
A
Quota sampling
B
Simple random sampling
C
Systematic sampling
D
Cluster sampling
E
Stratified sampling
Açıklama:
The researcher is dividing the population to groups, so he is uing the quota method.
Soru 69
"In _________________ sampling method, the members, who are identified previously, are asked to identify other members of the population. As newly identified members name others, the sample is getting larger." Which of the following completes the blank in given sentence?
Seçenekler
A
Cluster
B
Systematic
C
Simple random
D
Stratified
E
Snowball
Açıklama:
The defined method is snowball sampling method, as the sample gets larger like a snowball.
Soru 70
How many different subgroups of 5 members can be obtained from a population of 8 members?
Seçenekler
A
15
B
35
C
42
D
56
E
336
Açıklama:
C(8,5)=8!/(5!*3!)=56 different groups can be selected.
Ünite 2
Soru 1
Sample values for a continuous variable are as follows (laptop computer's temperature in an hour ; as oC) : 42, 45, 47, 54, and 58. What is the point estimate of the population arithmetic mean?
Seçenekler
A
48.1
B
48.5
C
49.2
D
50.4
E
52.0
Açıklama:
x = (42 + 45 + 47 + 54 + 58) / 5 = 49.2. pg. 24. Correct answer is C.
Soru 2
Sample values for a continuous variable (rain drop rate ; as kg / hour) : 110, 125, 155, 130, 180, and 80. What is the point estimate of the population arithmetic mean?
Seçenekler
A
120.0
B
127.5
C
130.0
D
137.5
E
140.0
Açıklama:
x = (110 + 125 + 155 + 130 + 180 + 80) / 6 = 780 / 6 = 130. pg. 24. Correct answer is D.
Soru 3
Sample values for a continuous variable are as follows (phone charger output voltage ; as volt) : 4.4, 5.6, 4.5, and 5.5. What is the point estimate of the population arithmetic mean?
Seçenekler
A
4.6
B
4.8
C
5.0
D
5.2
E
5.4
Açıklama:
x = (4.4 + 5.6 + 4.5 + 5.5) /4 = 5. pg. 24. Correct answer is C.
Soru 4
Sample values for a continuous variable are as follows (noise level of a laptop computer ; as decibel) : 16, 19, 23, 24, 27, 32, 17, and 10. What is the point estimate of the population arithmetic mean?
Seçenekler
A
18.0
B
19.0
C
20.0
D
21.0
E
22.5
Açıklama:
x = (16 + 19 + 23 + 24 + 27 + 32 + 17 + 10) / 8 = 21. pg. 24. Correct answer is D.
Soru 5
There are 28 red apples, 24 green apples, 16 immature apples, 32 red tomatoes, 16 green tomatoes, and 20 immatue tomatoes in a box. What is the population proportion estimate of immature things in this box ?
Seçenekler
A
5 / 32
B
9 / 34
C
11 / 90
D
13 / 80
E
15 / 128
Açıklama:
x = (16 + 20) / (28 + 24 + 16 + 32 + 16 + 20) = 36 / 136 = 9 / 34. pg. 25 . Correct answer is B
Soru 6
The frequency of completion of Eskişehir Porsuk river swimming marathon in a sample of 180 is 72. What is the point estimate of population proportion for completion of swimming marathon?
Seçenekler
A
0.90
B
0.85
C
0.40
D
0.35
E
0.18
Açıklama:
x = 72 / 180 = 0.40. pg. 25. Correct answer is C.
Soru 7
In Interval estimation problem: the sample arithmetic mean is 26 and the upper limit of the confidence interval is 33, then what is the lower limit of the confidence interval?
Seçenekler
A
23
B
21
C
20
D
19
E
17
Açıklama:
26 = (x + 33) / 2 ; x = 19. pg. 33. Correct answer is D.
Soru 8
Interval estimation : the limits of the confidence interval are (99, 123), the significance level is 0.01. What is the sample arithmetic mean?
Seçenekler
A
104
B
111
C
112
D
114
E
117
Açıklama:
x = (99 + 123) / 2 = 111. pg. 33. Correct answer is B.
Soru 9
Interval estimation : the limits of the confidence interval are (4.1, 5.9), the significance level is 0.05. What is the sample arithmetic mean?
Seçenekler
A
4.15
B
4.60
C
5.00
D
5.30
E
5.85
Açıklama:
x = (4.1 + 5.9) / 2 = 5. pg. 33. Correct answer is C.
Soru 10
In Interval estimation problem : the population standard deviation is not known, the sample standard deviation is 50, there are 25 observations in the sample. What is the value of the standard error to calculate the confidence interval?
Seçenekler
A
2
B
4
C
6
D
10
E
25
Açıklama:
st err = st dev / (n)1/2 = 50 / (25)1/2 = 10. pg. 38. Correct answer is D.
Soru 11
An investigator has created a sample arithmetic mean and used the number found as the population parameter value, What kind of estimation is used in this process?
Seçenekler
A
Hypothesis testing
B
Interval Estimation
C
Regression
D
Point estimation
E
Variance
Açıklama:
In its simplest sense, when a point estimate of a population parameter is created, it means that only one number represents the value of the population parameter. For example, the sample arithmetic mean is a very good estimator of the population arithmetic mean; If you take a random sample of 100 objects from a population with 10,000 observations, and calculate the arithmetic mean of a measurable characteristic of the observations (such as the height of the objects, as our variable of interest) in your sample, you may estimate the real arithmetic mean of the variable height for the population by accepting that the value of the sample arithmetic mean is equal to the value of the population arithmetic mean. This is called point estimation.
Soru 12
In interval estimation, a ___________ is given for the value of a population parameter?
Seçenekler
A
point
B
observation
C
range
D
hypothesis
E
average
Açıklama:
In interval estimation, a range is given for the value of a population parameter.
Soru 13
A person makes an estimation about population parameter and gives a range for the value of the parameter. What kind of estimation procedure is followed in this situation?
Seçenekler
A
point
B
hypothesis
C
variance
D
Interval
E
Divisive
Açıklama:
In interval estimation, a range is given for the value of a population parameter.
Soru 14
A random sample of a data set is as follows: 3, 4, 4, 4, 7,4, 5, 6, 7, and 9. What is the point estimate of the population arithmetic mean?
Seçenekler
A
2.40
B
3.80
C
4.25
D
4.90
E
5.30
Açıklama:
We need to calculate sample arithmetic mean and use it as point estimate of population arithmetic mean therefore
mean= 53/ 10=5.30
mean= 53/ 10=5.30
Soru 15
A scientist collects data and finds the arithmetic mean of the data as 23.64. What is the point estimate of the population arithmetic mean?
Seçenekler
A
19.87
B
23.64
C
28.43
D
36.19
E
41.82
Açıklama:
Point estimate is the same with the sample arithmetic mean.
Soru 16
In a sample there is 45 people and 25 of them are female, what is the point estimate of the population proportion of females?
Seçenekler
A
56%
B
67%
C
72%
D
85%
E
92%
Açıklama:
Population proportion's point estimate is
P=f/n=25/45=0.55556
P=f/n=25/45=0.55556
Soru 17
If a sample proportion of a variable in an investigation is 42%, then what is the point estimate of the population proportion?
Seçenekler
A
58%
B
52%
C
42%
D
69%
E
92%
Açıklama:
It will be same as the sample proportion
Soru 18
___________ of the sample mean is the probability distribution of all possible sample means that can be created from a population with a fixed sample size of n?
Seçenekler
A
Variance
B
Mode
C
The sampling distribution
D
Hypothesis testing
E
Regression
Açıklama:
The sampling distribution of the sample mean is the probability distribution of all possible sample means that can be created from a population with a fixed sample size of n.
Soru 19
How many different samples of size 2 can be created from this population with 7 students?
Seçenekler
A
11
B
15
C
18
D
21
E
27
Açıklama:
C(7,2)=7!/(2!*(7-2)!)=21
Soru 20
In a problem, the population arithmetic mean is estimated via interval estimation, after some calculations, the sample mean is found as 45 and the lower limit of the interval is 40, therefore what is the upper limit of the interval estimate of the population arithmetic mean?
Seçenekler
A
35
B
30
C
47
D
50
E
55
Açıklama:
Since the interval estimate is symmetric around the sample there is a difference of 5 between the sample mean and lower limit, therefore the result we are looking for is 45 + 5 =50.
Soru 21
Sample values for a continuous variable (sea water temperature in a day ; as oF) : 70, 71, 72, 76, 77, and 78. What is the point estimate of the population arithmetic mean?
Seçenekler
A
74.0
B
73.5
C
74.5
D
75.5
E
75.0
Açıklama:
x = (70 + 71 + 72 + 76 + 77 + 78) / 6 = 74. pg. 24. Correct answer is A.
Soru 22
Sample values for a continuous variable (Eskişehir Porsuk river current flow rate ; as m3 / second) : 4, 5, 8, 11, and 12. What is the point estimate of the population arithmetic mean?
Seçenekler
A
9.0
B
8.5
C
8.0
D
7.5
E
7.0
Açıklama:
x = (4 + 5 + 8 + 11 + 12 / 5 = 40 / 5 = 8 . pg. 24. Correct answer is C.
Soru 23
Sample values for a continuous variable (electric current at home ; as amper) : 2, 3, 6, 9, 10, and 18. What is the point estimate of the population arithmetic mean?
Seçenekler
A
11.0
B
8.0
C
10.5
D
9.5
E
9.0
Açıklama:
x = (2 + 3 + 6 + 9 + 10 + 18) / 6 = 8. pg. 24. Correct answer is B.
Soru 24
Sample values for a continuous variable (noise level in Anadolu University Botanic Garden ; as decibel) : 21, 29, 34, 50, 55, 62, and 71. What is the point estimate of the population arithmetic mean?
Seçenekler
A
49
B
50
C
48
D
46
E
47
Açıklama:
x = (21 + 29 + 34 + 50 + 55 + 62 + 71) / 7 = 46. pg. 24. Correct answer is D.
Soru 25
There are 5 Aegean big fishes, 12 Aegean medium fishes, 19 Aegean small fishes, 9 Mediterranean big fishes, 16 Mediterranean medium fishes, and 23 Mediterranean small fishes in an aquarium. What is the population proportion estimate of big fishes in this aquarium?
Seçenekler
A
1 / 3
B
2 / 5
C
3 / 8
D
2 / 9
E
1 / 6
Açıklama:
x = (5 + 9) / (5 + 12 + 19 + 9 + 16 + 23) = 14 / 84 = 1 / 6. pg. 25 . Correct answer is E.
Soru 26
The frequency of 3 point field goals of a basketball player in a sample of 360 is 216. What is the point estimate of population proportion for 3 point field goals of this basketball player?
Seçenekler
A
0.25
B
0.30
C
0.40
D
0.60
E
0.75
Açıklama:
x = 216 / 360 = 0.60. pg. 25. Correct answer is D.
Soru 27
Interval estimation : the sample arithmetic mean is 87 and the lower limit of the confidence interval is 78, then what is the upper limit of the confidence interval?
Seçenekler
A
91
B
100
C
96
D
98
E
93
Açıklama:
87 = (78 + x) / 2 ; x = 96. pg. 33. Correct answer is C.
Soru 28
Interval estimation : the limits of the confidence interval are (397, 555), the significance level is 0.05. What is the sample arithmetic mean?
Seçenekler
A
476
B
421
C
452
D
463
E
484
Açıklama:
x = (397 + 555) / 2 = 476. pg. 33. Correct answer is A.
Soru 29
Interval estimation : the limits of the confidence interval are (0.41, 0.97), the significance level is 0.01. What is the sample arithmetic mean?
Seçenekler
A
0.78
B
0.69
C
0.71
D
0.73
E
0.58
Açıklama:
x = (0.41 + 0.97) / 2 = 0.69. pg. 33. Correct answer is B.
Soru 30
Interval estimation problem : the population standard deviation is not known, the sample standard deviation is 28, there are 49 observations in the sample. What is the value of the standard error to calculate the confidence interval?
Seçenekler
A
18
B
9
C
14
D
3
E
4
Açıklama:
st err = st dev / (n)1/2 = 28 / (49)1/2 = 4. pg. 38. Correct answer is E.
Soru 31
25, 45, 55, 35, 40
What is the estimation of the arithmetic mean of the data set given above?
What is the estimation of the arithmetic mean of the data set given above?
Seçenekler
A
25
B
35
C
40
D
45
E
50
Açıklama:
the estimation of the arithmetic mean of the data set given in the question is calculated as below
(25 + 45 + 55 + 35 + 40) / 5 = 40.
(25 + 45 + 55 + 35 + 40) / 5 = 40.
Soru 32
I. The probability distribution of the statistic is called its sampling distribution
II. The observations are selected randomly from the population
III. In a sample, observations are selected deliberately in order to manipulate the estimation
Which of the above are true about the features of point estimation?
II. The observations are selected randomly from the population
III. In a sample, observations are selected deliberately in order to manipulate the estimation
Which of the above are true about the features of point estimation?
Seçenekler
A
Only I
B
I and II
C
I and III
D
II and III
E
I, II and III
Açıklama:
The features of point estimation can be summarized as follows.
1. An unknown population parameter is to be estimated.
2. A sample including n independent observations is selected randomly from the population and a particular function of the sample observations is used as an estimate of the parameter.
3. The sample observations are obtained from the independent random variables X1, X2, ... Xn. Thus, the statistic to be calculated is also a random variable. Therefore, the probability distribution of the statistic is called its sampling distribution.
Based on the explanation given here, I and II are true whereas III is false. The correct answer for the question is B.
Soru 33
What is the female proportion of a sample with 30 males from a group of 120 students?
Seçenekler
A
0.30
B
0.40
C
0.60
D
0.75
E
0.90
Açıklama:
(120 - 30) /120 = 90 /120 = 3 / 4 = 0.75
Based on this, the answer is D.
Based on this, the answer is D.
Soru 34
What is the sample proportion of a sample with frequency (f) 450 and sample size (n) 9000?
Seçenekler
A
0.01
B
0.05
C
0.25
D
0.45
E
0.90
Açıklama:
proportion (p) = f / n = 450 / 9000 = 0.05
Therefore, the answer is B.
Therefore, the answer is B.
Soru 35
How many different samples of size two can be created from this population with 6 students when the sample size is 3?
Seçenekler
A
2
B
3
C
6
D
10
E
20
Açıklama:
C (6,3) = 6! / ( 3! (6-3)!) =20
Therefore, the correct answer is E
Therefore, the correct answer is E
Soru 36
As the Central Limit Theorem states, What is the type of distribution of the independent samples approximates?
Seçenekler
A
Binomial distribution
B
Formal distribution
C
Normal distribution
D
Lognormal distribution
E
Weibull distribution
Açıklama:
If you take independent samples one by one from a population with known arithmetic mean and standard deviation and calculate the means of these samples, central limit theorem states that the shape of the distribution of the sample means will be approximately Normal distribution.
Based on this explanation, the correct answer is C
Based on this explanation, the correct answer is C
Soru 37
"For an interval estimation, If you choose the ________ as 0.01, then it means that the _______ on your estimation is (1 - α) = (1 - 0.01) = 0.99."
Which of the following are the correct terms with an order for the given sentence above?
Which of the following are the correct terms with an order for the given sentence above?
Seçenekler
A
Level of confidence - significance level
B
Significance level - level of confidence
C
Significance level - confidence interval
D
Frequency - level of confidence
E
Probability - Distribution
Açıklama:
"If you choose the significance level as 0.01, then it means that the level of confidence on your estimation is (1 - α) = (1 - 0.01) = 0.99."
So, the terms are "Significance level" and "level of confidence". The correct answer is B
So, the terms are "Significance level" and "level of confidence". The correct answer is B
Soru 38
What is the indicator of the precision for an estimation of a population parameter with a given sample size and alpha?
Seçenekler
A
The confidence interval
B
The level of significance
C
Population parameter estimation
D
Sample size
E
Point estiomation
Açıklama:
Confidence interval thereby indicates the precision with which a population parameter is estimated by a sample statistic, given n and α.
By the given explanation, the answer is A.
By the given explanation, the answer is A.
Soru 39
Which of the following is not necessary when calculation a confidence interval for an unknown population mean?
Seçenekler
A
Sample mean
B
Standart deviation of the sample
C
Level of significance
D
Z value from standard normal distribution table
E
Type of population distribution
Açıklama:
when calculation a confidence interval for an unknown population mean, mean and standard deviation of the sample is required as well as the Z score obtained from the standard normal distribution table for a specified level of significance. However, the distribution type of the population is not required as it is assumed to be a normal distribution by Central Limit Theorem. Therefore the answer to the question is E
Soru 40
12, 8, 7, 6 15, 22
What is the standard deviation of the sample given above?
What is the standard deviation of the sample given above?
Seçenekler
A
4.2
B
5.6
C
6.1
D
7.2
E
7.6
Açıklama:
First is to calculate sample mean: (12+8+7+6+15+22) / 6 = 11.6667
Second is to calculate standard deviation:
( ( (12-11,6667)^2+(8-11,6667)^2+(7-11,6667)^2+(6-11,6667)^2+(15-11,6667)^2+(22-11,6667)^2) ) / 5 ) ^(1/2) = 6,088
This result is rounded to 6,1 and thus, the answer is C.
Second is to calculate standard deviation:
( ( (12-11,6667)^2+(8-11,6667)^2+(7-11,6667)^2+(6-11,6667)^2+(15-11,6667)^2+(22-11,6667)^2) ) / 5 ) ^(1/2) = 6,088
This result is rounded to 6,1 and thus, the answer is C.
Soru 41
Sample values for a continuous variable (weather temperature in a day ; as oC) : 10, 16, 20, and 28. What is the point estimate of the population arithmetic mean?
Seçenekler
A
18.0
B
18.5
C
19.0
D
19.5
E
20.0
Açıklama:
x = (10 + 16 + 20 + 28) / 4 . pg. 24. Correct answer is B.
Soru 42
Sample values for a continuous variable (water flow rate ; as liter / hour) : 6, 12, 17, 36, 26, 15, 34, and 2. What is the point estimate of the population arithmetic mean?
Seçenekler
A
20.0
B
19.5
C
19.0
D
18.5
E
18.0
Açıklama:
x = (6 + 12 + 17 + 36 + 26 + 15 + 34 + 2) / 8 = 148 / 8 = . pg. 24. Correct answer is D.
Soru 43
Sample values for a continuous variable (electric voltage at home ; as volt) : 204, 214, 226, 234, and 242. What is the point estimate of the population arithmetic mean?
Seçenekler
A
220
B
222
C
224
D
226
E
228
Açıklama:
x = (204 + 214 + 226 + 234 + 242) /5 = 224. pg. 24. Correct answer is C.
Soru 44
Sample values for a continuous variable (noise level in a classroom ; as decibel) : 32, 38, 46, 48, 54, and 64. What is the point estimate of the population arithmetic mean?
Seçenekler
A
46
B
47
C
48
D
49
E
50
Açıklama:
x = (32 + 38 + 46 + 48 + 54 + 64) / 6 = 47. pg. 24. Correct answer is B.
Soru 45
There are 24 female ducks, 21 male ducks, 15 baby ducks, 27 female gooses, 18 male gooses, and 12 baby gooses in a farm. What is the population proportion estimate of babies in this farm?
Seçenekler
A
3/13
B
13/3
C
27/100
D
100/27
E
13/160
Açıklama:
x = (15 + 12) / (24 + 21 + 15 + 27 + 18 + 12) = 27 / 117 = 3 / 13. pg. 25 . Correct answer is A.
Soru 46
The frequency of recovery from illness after therapy A in a sample of 640 is 160. What is the point estimate of population proportion for recovery from illness?
Seçenekler
A
0.95
B
0.90
C
0.64
D
0.25
E
0.16
Açıklama:
x = 160 / 640 = 0.25. pg. 25. Correct answer is D.
Soru 47
Interval estimation : the sample arithmetic mean is 14 and the lower limit of the confidence interval is 6, then what is the upper limit of the confidence interval?
Seçenekler
A
10
B
11
C
17
D
20
E
22
Açıklama:
14 = (6 + x) / 2 ; x = 22. pg. 33. Correct answer is E.
Soru 48
Interval estimation : the limits of the confidence interval are (205, 245), the significance level is 0.05. What is the sample arithmetic mean?
Seçenekler
A
210
B
215
C
225
D
235
E
240
Açıklama:
x = (205 + 245) / 2 = 225. pg. 33. Correct answer is C.
Soru 49
Interval estimation : the limits of the confidence interval are (49.6, 50.4), the significance level is 0.01. What is the sample arithmetic mean?
Seçenekler
A
49.8
B
49.0
C
50.0
D
50.1
E
50.2
Açıklama:
x = (49.6 + 50.4) / 2 = 50. pg. 33. Correct answer is C.
Soru 50
Interval estimation problem : the population standard deviation is not known, the sample standard deviation is 36, there are 9 observations in the sample. What is the value of the standard error to calculate the confidence interval?
Seçenekler
A
12
B
9
C
6
D
4
E
2
Açıklama:
st err = st dev / (n)1/2 = 36 / (9)1/2 = 12. pg. 38 Correct answer is A.
Soru 51
For age variable the following sample data is gathered: 45, 47, 42, 40, and 51. What is the point estimate of the population arithmetic mean for variable age?
Seçenekler
A
45
B
42
C
40
D
49
E
57
Açıklama:
We need to calculate the sample arithmetic mean, it is equal to 45.
Soru 52
In poin estimation, What is sample statistic called for population parameter?
Seçenekler
A
Predicted
B
Estimate
C
Final value
D
Data
E
Variability
Açıklama:
To obtain information about a population parameter, such as the value of population mean μ or population proportion π, a random sample of objects from the population is usually created. Then, the sample statistic found from the values of the sample observations is used for predictions about population parameter. This sample statistic is called an estimate of the population parameter.
Soru 53
The process of estimating a population parameter by a single number derived from the sample is called _______________ estimation?
Seçenekler
A
Default
B
Unknown
C
Interval
D
Variable
E
Point
Açıklama:
The process of estimating a population parameter by a single number derived from the sample is called point estimation.
Soru 54
___________________________, denoted by π, is the proportion of the members/objects/individuals of a population that have a specific characteristic of interest?
Seçenekler
A
A population arithmetic mean
B
Sample arithmetic mean
C
Sample standard deviation
D
Population Variance
E
A population proportion
Açıklama:
A population proportion, denoted by π, is the proportion of the members/objects/individuals of a population that have a specific characteristic of interest.
Soru 55
the government policy planner is selected 4000 people from the population using cluster sampling, clusters are organized according to the geographical regions. Then, planner is found that the 1000 people in the sample live under the poverty threshold. What is the point estimate of the population proportion?
Seçenekler
A
0.75
B
0.25
C
0.50
D
0.15
E
0.90
Açıklama:
p = f/n
In the equation, f is the sample frequency and n is the sample size.
In order find the point estimate
1000/4000=0.25.
In the equation, f is the sample frequency and n is the sample size.
In order find the point estimate
1000/4000=0.25.
Soru 56
____________________________ is the probability distribution of all possible sample means that can be created from a population with a fixed sample size of n.
Seçenekler
A
The sampling distribution of the sample variance
B
The sampling distribution of the sample standard deviation
C
The sampling distribution of the sample mean
D
The sampling distribution of the sample median
E
The sampling distribution of the sample mode
Açıklama:
The sampling distribution of the sample mean is the probability distribution of all possible sample means that can be created from a population with a fixed sample size of n.
Soru 57
In a population there are 5 observations as follows: 10, 90, 20, 80, 50. What is the arithmetic mean of the sampling distribution of the sample mean for all the samples with the size 2?
Seçenekler
A
50
B
80
C
90
D
10
E
100
Açıklama:
It will be equal to the population arithmetic mean and the population arithmetic mean in this problem is 50.
Soru 58
The standard deviation of the sampling distribution of the sample mean is ___________ than the population standard deviation?
Seçenekler
A
equal
B
bigger
C
smaller
D
over
E
missing
Açıklama:
the standard deviation of the sampling distribution of the sample mean is smaller than the population standard deviation.
Soru 59
In a population there are 5 observations, how many different samples of size 4 can be created from this population?
Seçenekler
A
1
B
3
C
5
D
8
E
15
Açıklama:
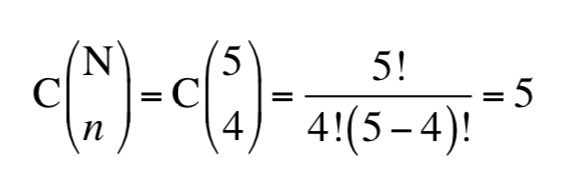
Soru 60
In an interval estimation problem for population arithmetic mean; z =1.96, population standard deviation =12, n=16 and sample arithmetic mean = 28. What is the upper limit of the confidence interval for population mean?
Seçenekler
A
35.89
B
42.98
C
49.17
D
35.79
E
33.88
Açıklama:
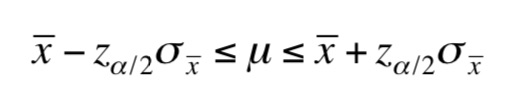
28 + 1.96 * (12 / sqrt(16)) = 33.88
Ünite 3
Soru 1
What is a value that defines the characteristic of a whole population called?
Seçenekler
A
Parameter
B
Mean
C
Variance
D
Mode
E
Median
Açıklama:
A parameter is a value that defines the characteristic of a whole population which means that population parameter consists of mean, variance, standard deviation, mode, median or proportion of the population or objects under consideration.
Soru 2
1. Formulate a decision rule
2. Identify the test statistic
3. State null and alternate hypotheses
4. Select a level of significance
5. Take a sample and make the decision
What is the correct order of the hypothesis testing steps given above?
2. Identify the test statistic
3. State null and alternate hypotheses
4. Select a level of significance
5. Take a sample and make the decision
What is the correct order of the hypothesis testing steps given above?
Seçenekler
A
4-3-2-1-5
B
3-4-2-5-1
C
3-4-2-1-5
D
2-3-4-1-5
E
2-3-4-5-1
Açıklama:
To test the claims made about the population parameters or in other words to test the statistical expressions the following steps can be followed: Step 1: State null and alternate hypotheses Step 2: Select a level of significance Step 3: Identify the test statistic Step 4: Formulate a decision rule Step 5: Take a sample and make the decision. The correct answer is C.
Soru 3
Which of the following is NOT a statistical hypothesis?
Seçenekler
A
The mean age of students in a classroom is 26.5 years.
B
The variance of the fuel consumption of a certain model car under various road and traffic condition is 0.76 litre per 100 kilometre.
C
The battery manufacturer claims that the average number of charge cycle is about 900 charge cycles for the specific type of rechargeable batteries
D
The proportion of people wearing eyeglasses is almost four times higher than that the proportion of the contact lens users.
E
The students who study in a library recall more information than students who study at home.
Açıklama:
In general, a hypothesis is a proposition for the specific situation encountered. Conversely a statistical hypothesis that specifies a single value for a population parameter and validity of this parameter is based on generating statistics which can be investigated by sampling distribution of the concerned information. In other words, statistical hypothesis utilizes sample statistics to determine whether a hypothesis is true or not. The correct answer is E.
Soru 4
What is a statistical statement which specifies that there is a specific value of a population parameter?
Seçenekler
A
Null hypothesis
B
Alternate hypothesis
C
Test statistic
D
Parameter
E
Decision rule
Açıklama:
The null hypothesis H0 is a statistical statement which specifies that there is a specific value of a population parameter. Generally thought as the status quo. It is what you already know about the population parameter. The correct answer is A.
Soru 5
Which of the following is true about t distribution?
Seçenekler
A
The total area under a t-curve is 1 or 100%.
B
The t distribution is unsymmetrical.
C
The mean of the t distribution is always equal to one.
D
The median and mode of the t distribution is always equal to one.
E
As the degrees of freedom decreases from 28 to 1, the shape of the t distribution approaches to the standard normal distribution.
Açıklama:
Certain properties of the t distribution are as follows: • The t distribution is bell shaped and symmetrical. The total area under a t-curve is 1 or 100% • The mean, median and mode of the t distribution is all equal to zero. • As the degrees of freedom increases, the shape of the t distribution approaches to the standard normal distribution. The correct answer is A.
Soru 6
In which situation below, can hypothesis tests for proportions be used?
Seçenekler
A
Mid-term results of students who have a score above fifty
B
Quality engineers test the proportion of parts that are defective or not defective
C
The workers who are older than 50 years old
D
The engineers who use the new management software
E
The teacher who take online professional development courses
Açıklama:
Hypothesis tests for proportions can be used if the parameter of interest is a proportion of a population in which there are two different categories. Such as, mid-term results of students who have a score below or above fifty, or quality engineers test the proportion of parts that are defective or not defective. From these examples, it is clear that the statistical hypothesis test involving a proportion of the population can be considered as a binomial experiment since there are two outcomes. The correct answer is B.
Soru 7
In an investigation, if the significance level is 0.47, what is the confidence level in this study?
Seçenekler
A
0.47
B
0.53
C
0.05
D
-1
E
0.1
Açıklama:
In an investigation, if the significance level is 0.47, the confidence level must be 0.53 as their sum must be equal to 1.
Soru 8
The weight variable is σ = 25. It is known that the distribution of the weights of the packages follow a normal distribution. A sample of 32 observations is randomly selected from the production line in the afternoon and the sample average is found as of 448 grams.
What should be alternate hyphothesis in this situation?
What should be alternate hyphothesis in this situation?
Seçenekler
A
The mean weight of the packages is less than 448 grams.
B
The mean weight of the packages is less than 450 grams
C
The mean weight of the packages is equal to 448 grams.
D
The mean weight of the packages is equal to 450 grams.
E
The mean weight of the packages is more than 448 grams.
Açıklama:
The null hypothesis (H0 ) is “the mean weight of the packages is 450 grams” and the alternative hypothesis (H1 ) is “the mean weight of the packages is less than 450 grams”. The correct answer is B.
Soru 9
A power bank’s charging time is 5 hours. 50 power banks are selected and tested for their charging time. The average charging time of these power banks is 5.05 hours. It’s assumed that the power bank charging time is normally distributed with a standard deviation as σ = 0.2 hours.
What is the sample size (n) according to the situation above?
What is the sample size (n) according to the situation above?
Seçenekler
A
5
B
0.5
C
5.5
D
50
E
0.2
Açıklama:
A random sample of 50 power banks is selected and tested for their charging time. The sample size (n) is 50. The correct answer is D.
Soru 10
For two-sided test on one population hypothesis testing with α = 0.05 and n = 15, what is the degrees of freedom?
Seçenekler
A
15,05
B
1,05
C
14
D
15
E
16
Açıklama:
The degrees of freedom is, d.f = n - 1 = 15 - 1 = 14. The correct answer is C.
Soru 11
Which is the first step to test the claims made about the population parameters?
Seçenekler
A
Take a sample and make the decision
B
Formulate a decision rule
C
Identify the test statistic
D
Select a level of significance
E
State null and alternate hypotheses
Açıklama:
To test the claims made about the population parameters or in other words to test the statistical expressions the following steps can be followed:
Step 1: State null and alternate hypotheses
Step 2: Select a level of significance
Step 3: Identify the test statistic
Step 4: Formulate a decision rule
Step 5: Take a sample and make the decision
The answer is E.
Step 1: State null and alternate hypotheses
Step 2: Select a level of significance
Step 3: Identify the test statistic
Step 4: Formulate a decision rule
Step 5: Take a sample and make the decision
The answer is E.
Soru 12
I. The null hypothesis defines what the decision maker’s conclusion is if he/she accepts the alternative hypothesis.
II. The null hypothesis H0 is a statistical statement which specifies that there is a specific value of a population parameter.
III. The alternative hypothesis H1 specifies that there is a difference between the value of a population parameter and a certain value.
Which of the given statements can be said about the null and alternative hypotheses?
Seçenekler
A
Only I
B
Only II
C
I and II
D
I and III
E
II and III
Açıklama:
The null hypothesis H0 is a statistical statement which specifies that there is a specific value of a population parameter. Generally thought as the status quo. It is what you already know about the population parameter. On the other hand, the alternative hypothesis H1 specifies that there is a difference between the value of a population parameter and a certain value. Alternative hypothesis is also called as research hypothesis since the alternative hypothesis defines what the decision maker’s conclusion is if he/she rejects the null hypothesis.
The answer is E.
The answer is E.
Soru 13
I. The alternative hypothesis can be expressed in three different ways according to the purpose of the research question.
II. H1: θ ≠ θ0 A hypothesis test whose alternative hypothesis (H1) has this form named as the one-tailed test or one-sided alternative hypothesis.
III. Right-tailed and left tailed hypothesis tests are also called a two-tailed test or two-sided alternative hypothesis.
Which of these statements about hypothesis testing are true?
Seçenekler
A
Only I
B
Only II
C
I and II
D
I and III
E
II and III
Açıklama:
I. The alternative hypothesis can be expressed in three different ways according to the purpose of the research question. (True)
II. H1: θ ≠ θ0 A hypothesis test whose alternative hypothesis (H1) has this form named as the one-tailed test or one-sided alternative hypothesis. (False, H1: θ ≠ θ0 A hypothesis test whose alternative hypothesis (H1) has this form named as the two-tailed test or two-sided alternative hypothesis.)
III. Right-tailed and left tailed hypothesis tests are also called a two-tailed test or two-sided alternative hypothesis. (False, Right-tailed and left tailed hypothesis tests are also called a one-tailed test or one-sided alternative hypothesis.)
The answer is A.
Soru 14
I. There are four possible correct and incorrect decision-making situations that may occur through statistical hypothesis testing.
II. Type I error is defined as failing to reject the null hypothesis (H0) when it is actually false.
III. Type II error is defined as rejecting the null hypothesis (H0) when it is actually true.
Which of the given statements about incorrect decisions through hypothesis testing can be said to be true?
Seçenekler
A
Only I
B
Only II
C
I and II
D
I and III
E
II and III
Açıklama:
I. There are four possible correct and incorrect decision-making situations that may occur through statistical hypothesis testing. (True)
II. Type I error is defined as failing to reject the null hypothesis (H0) when it is actually false. (False, type I error is defined as rejecting the null hypothesis (H0) when it is actually true.)
III. Type II error is defined as rejecting the null hypothesis (H0) when it is actually true. (False, type II error is defined as failing to reject the null hypothesis (H0) when it is actually false.)
The answer is A.
Soru 15
If a researcher fails to reject the null hypothesis (H0) and the H0 is false what can be said?
Seçenekler
A
Type I error (α)
B
Type II error (β)
C
Correct decision
D
Not enough information
E
Too much information
Açıklama:
Through a hypothesis-testing, it is also important to consider the probability of a type II error, failing to reject the null hypothesis (H0) when it is false, which is denoted by β. Then the type
II error probability is, β = P(type I error) = P(fail to reject the null hypothesis H0 when it is actually false)
The answer is B.
II error probability is, β = P(type I error) = P(fail to reject the null hypothesis H0 when it is actually false)
The answer is B.
Soru 16
For α = 0.24 significance level what is the acceptance area under the standard normal curve for two-sided tests?
Seçenekler
A
0.04
B
0.16
C
0.24
D
0.76
E
0.86
Açıklama:
For a two-sided test the acceptance area under the standard normal curve is calculated by 1-α which is equal to 1 - 0.24 = 0.76
The answer is D
The answer is D
Soru 17
For α = 0.567 significance level what is the rejection area under the standard normal curve for one-sided tests?
Seçenekler
A
0.500
B
0.567
C
0.673
D
0.753
E
0.900
Açıklama:
For a one-sided test, the rejection area under the standard normal curve is equal to α, which is equal to 0.567
The answer is B
The answer is B
Soru 18
For a statistical test following a normal distribution, the alternative hypothesis is that the mean equals to a thousand and the standard deviation is σ = 24. A sample of 576 observations is randomly selected and the sample average is equal to 1020. What is the test statistic equal to?
Seçenekler
A
5
B
10
C
20
D
30
E
40
Açıklama:
The test statistic is calculated according to this formula: z = (x −µ)/(σ / (n)1/2 ). Here x=1900, µ=1000, σ=24, n=576, if we plug the numbers into the formula we would have z = (1020 −1000)/(24 / (576)1/2 ) which is equal to 20
The answer is C
The answer is C
Soru 19
I. The mean, median and mode of the t distribution are all equal to zero.
II. The t distribution is bell-shaped and symmetrical. The total area under a t-curve is 1 or 100%
III. As the degrees of freedom decreases, the shape of the t-distribution approaches to the standard normal distribution.
Which of the given statements about properties of the t-distribution are true?
II. The t distribution is bell-shaped and symmetrical. The total area under a t-curve is 1 or 100%
III. As the degrees of freedom decreases, the shape of the t-distribution approaches to the standard normal distribution.
Which of the given statements about properties of the t-distribution are true?
Seçenekler
A
Only I
B
Only II
C
I and II
D
I and III
E
II and III
Açıklama:
Certain properties of the t distribution are as follows:
• The t distribution is bell-shaped and symmetrical. The total area under a t-curve is 1 or 100%
• The mean, median and mode of the t distribution are all equal to zero.
• As the degrees of freedom increases, the shape of the t distribution approaches to the standard normal distribution.
The answer is C.
Soru 20
For a statistical test following a normal distribution, the alternative hypothesis is that the mean equals to a hundred and the standard deviation is s = 20. A sample of 25 observations is randomly selected and the sample average is equal to 102. What is the test statistic equal to?
Seçenekler
A
0.35
B
0.40
C
0.45
D
0.5
E
0.55
Açıklama:
The observation is equal to 25 which is less than 30, so we use this formula to calculate the test statistics: t = (x −µ)/(s / (n)1/2). Here x=102, µ=100, s=20, n=25 this yields to t = (102 −100)/(20 / (25)1/2) which is equal to 1/2=0.5
The answer is D.
The answer is D.
Soru 21
- Identify the test statistic
- Select a level of significance
- State null and alternate hypotheses
- Take a sample and make the decision
- Formulate a decision rule
Seçenekler
A
I-III-II-IV-V
B
II-III-V-I-IV
C
III-II-I-V-IV
D
III-V-II-IV-I
E
IV-III-II-V-I
Açıklama:
Review the part 'Steps in Hypothesis Testing'
To test the claims made about the population parameters or in other words to test the statistical expressions the following steps can be followed:
Step 1: State null and alternate hypotheses
Step 2: Select a level of significance
Step 3: Identify the test statistic
Step 4: Formulate a decision rule
Step 5: Take a sample and make the decision
Soru 22
What does the term '1-β' indicate?
Seçenekler
A
Test power
B
Significance level
C
Type I error
D
Type II error
E
Rejection region
Açıklama:
Review the part 'Step 2: Select the Level of Significance'
Power of a statistical test can be calculated as 1- β.
Power of a statistical test can be calculated as 1- β.
Soru 23
In an investigation, the probability of failing to reject the null hypothesis (H0) when it is false is 0.05. What is the test power in this study?
Seçenekler
A
0.05
B
0.10
C
0.50
D
0.90
E
0.95
Açıklama:
Review the part 'Step 2: Select the Level of Significance'
The probability of failing to reject the null hypothesis (H0) when it is false is the definiton of type II error and it is 0.05.
Test power= 1- type II error.
The probability of failing to reject the null hypothesis (H0) when it is false is the definiton of type II error and it is 0.05.
Test power= 1- type II error.
Soru 24
What is the critical value t0 for two-sided test with α = 0.05 and n = 22?
Seçenekler
A
1.717
B
1.727
C
2.074
D
2.080
E
2.096
Açıklama:
Review the t distribution table at p.62
Look at the t distribution table at p.62
df=21
Significance level = 0.025 for one-sided
= 0.05 for two-sided
Look at the t distribution table at p.62
df=21
Significance level = 0.025 for one-sided
= 0.05 for two-sided
Soru 25
What is the critical value zfor one-sided test with %90 confidence level?
Seçenekler
A
1.29
B
1.65
C
1.96
D
2.58
E
2.72
Açıklama:
Review Table 3.2 at page 54
Soru 26
In a hypothesis testing procedure, the population mean and standard deviation are 800 and 200 respectively. On the other hand, sample arithmetic mean of a random sample of 225 observations is 950. If this procedure is followed, what is the value of the observed z?
Seçenekler
A
-11.25
B
-5.66
C
2.58
D
5.66
E
11.25
Açıklama:
Review the part 'HYPOTHESIS TESTING FOR THE POPULATION MEAN (LARGE SAMPLE)'
Use the z formula at page 58
Use the z formula at page 58
Soru 27
(Answer the question 7, 8 and 9 according to those information)
Consider the following hypothesis:
H0: μ = 80
H1: μ ≠ 80
A random sample of 16 observations is randomly selected from normally distributed population. The mean of the sample is 90 and the standard deviation of the sample is 5. Test the null hypothesis given above with %95 confidence level.
What is the critical value for that test procedure?
Seçenekler
A
1.753
B
2.131
C
2.120
D
1.746
E
1.566
Açıklama:
Review the t distribution table at page 62.
Soru 28
According to the given information at Question 7;
What is the calculated test statistics for that hypothesis test?
What is the calculated test statistics for that hypothesis test?
Seçenekler
A
-8
B
-6
C
2
D
8
E
10
Açıklama:
Review the t formula at 'HYPOTHESIS TESTING FOR THE POPULATION MEAN (SMALL SAMPLE)' part at page 61.
Soru 29
(Answer the questions 9 and 10 according to following information)
A sales manager assesses that %60 of their costumers are happy with their product. A sample of 150 customers were selected randomly and it was found that 80 of them are happy with the product. Test the sales manager assessment at %95 confidence level.
What is the test statistic at this hypothesis testing?
Seçenekler
A
-1.96
B
-1.75
C
1.96
D
2.04
E
2.16
Açıklama:
HYPOTHESIS TESTING FOR THE POPULATION PROPORTION(page 66)
Use z formula at page 66.
Use z formula at page 66.
Soru 30
Which one of the following statements is true about the statistical decision for question 9?
Seçenekler
A
Ho should be rejected since test statistic is bigger than the critical value.
B
Ho should be accepted since test statistic is bigger than the critical value.
C
Ho should be rejected since test statistic is less than the critical value.
D
Ho should be accepted since test statistic is less than the critical value.
E
Ho should be neither rejected nor accepted since test statistic is equal to the critical value.
Açıklama:
Review 'HYPOTHESIS TESTING FOR THE POPULATION PROPORTION' at page 66.
Soru 31
There are two types of incorrect decisions through hypothesis testing. Which of the following describes "type I error"?
Seçenekler
A
rejecting the null hypothesis when it is actually true
B
rejecting the alternate hypothesis when it is actually true
C
failing to reject the null hypothesis when it is actually false
D
failing to reject the alternate hypothesis when it is actually false
E
rejecting the null and alternate hypotheses when they are actually true
Açıklama:
Statistical hypothesis tests are used to make a decision about whether the null hypothesis should be accepted or rejected. Since these conclusions are based on sample data, there is a risk of incorrect decision. There are two types of incorrect decisions through hypothesis testing: type I error and type II error. Type I error is defined as rejecting the null hypothesis (H0 ) when it is actually true. On the other hand, Type II error is defined as failing to reject the null hypothesis (H0 ) when it is actually false.
Soru 32
How is the power of a statistical test calculated?
Seçenekler
A
α - 1
B
β - 1
C
β + α
D
1- β
E
1 - α
Açıklama:
An additional important concept in statistical hypothesis testing is the power of the statistical test. The power of a statistical test is defined as the probability of rejecting the null hypothesis (H0 ) when the alternative hypothesis is actually true. Therefore, it could be inferred as the probability of correctly rejecting a null hypothesis (H0 ) when it is actually false. Then the power of a statistical test can be calculated as 1- β.
Soru 33
In hypothesis testing, which of the steps below is the first to be followed?
Seçenekler
A
Identify the test statistics
B
State null or alternate hypotheses
C
Formulate a decision rule
D
Select a level of significance
E
Take a sample and make a decision
Açıklama:
To test the claims made about the population parameters or in other words to test the statistical expressions the following steps can be followed: Step 1: State null and alternate hypotheses Step 2: Select a level of significance Step 3: Identify the test statistic Step 4: Formulate a decision rule Step 5: Take a sample and make the decision.
Soru 34
In a production line, the mean weight of the products should be 450 grams and the standard deviation of the weight variable is σ = 25. It is known that the distribution of the weights of the packages follow a normal distribution. A sample of 32 observations is randomly selected from the production line in the afternoon and the sample average is found as of 448 grams.The significance level α = 0.05 for this problem.
If you follow the five step hypothesis testing procedure, what is the alternative hypothesis for the situation given above ?
If you follow the five step hypothesis testing procedure, what is the alternative hypothesis for the situation given above ?
Seçenekler
A
The mean weight of the packages is 450 grams.
B
The mean weight of the packages is 448 grams.
C
the mean weight of the packages is not 450 grams.
D
The mean weight of the packages is less than 450 grams.
E
The mean weight of the packages is more than 450 grams.
Açıklama:
The null hypothesis (H0 ) is “the mean weight of the packages is 450 grams” and the alternative hypothesis (H1 ) is “the mean weight of the packages is less than 450 grams”. Here the alternative hypothesis is formed as a left tailed test because the given problem considers the weight of the packages than 450 grams.
Soru 35
The price of a certain electronic product at a chain store is 180 TL. The same electronic product is also available through various online stores and five of the store prices are as follows: 155, 179, 175, 175, 161 TL.
What is the null hypothesis for the problem given above?
What is the null hypothesis for the problem given above?
Seçenekler
A
H0 : μ = 180
B
H0 : μ > 180
C
H0 : μ < 180
D
H0 : μ < = 180
E
H0 : μ > = 180
Açıklama:
The statement in the question is the online stores mean price μ is less than the chain store, so the hypotheses are:
Null Hypothesis : H0 : μ = 180
Alternative Hypothesis : H1 : μ < = 180
Null Hypothesis : H0 : μ = 180
Alternative Hypothesis : H1 : μ < = 180
Soru 36
The price of a certain electronic product at a chain store is 180 TL. The same electronic product is also available through various online stores and five of the store prices are as follows: 155, 179, 175, 175, 161 TL. Let’s assume that online prices are normally distributed and at the significance level α = 0.1.
Given the information above, what can we conclude about the mean online store price of the product?
Given the information above, what can we conclude about the mean online store price of the product?
Seçenekler
A
The average price of the product at online stores is less than 180 TL.
B
The average price of the product at online stores is more than 180 TL.
C
The average price of the product at online stores is 180 TL.
D
The average price of the product at online stores is 175 TL.
E
The average price of the product at online stores is 171 TL.
Açıklama:
Since the test statistic value t = - 1.367 < - 1.533 the test statistic falls in to the rejection area of the null hypothesis. Therefore, we reject the null hypothesis H0 : μ = 180 at the level of significance α = 0.1. In conclusion, we conclude that the average price of the product at online stores is less than 180 TL at the significance level α = 0.1.
Soru 37
I. Choose the level of significance α.
II. Determine the population proportion under study and form the null hypothesis (H0 ) and the alternative hypothesis (H1 ).
III. Identify the critical points and critical region for the hypothesis test.
IV. Calculate the test statistic z for proportions.
V. Based on sample information decide to reject or fail to reject the null hypothesis (H0 ) and interpret the results of the hypothesis test.
What is correct order of the steps of hypothesis testing given above?
Seçenekler
A
I- II - IV - III - V
B
II - I - IV - III- V
C
II- I - IV - V -III
D
II- I - III- IV - V
E
IV -II- I - III- V
Açıklama:
The steps in hypothesis testing are summarized below. 1. Determine the population proportion under study and form the null hypothesis (H0 ) and the alternative hypothesis (H1 ). 2. Choose the level of significance α. 3. Calculate the test statistic z for proportions. 4. Identify the critical points and critical region for the hypothesis test. 5. Based on sample information decide to reject or fail to reject the null hypothesis (H0 ) and interpret the results of the hypothesis test. Thefore, the correct answer is B.
Soru 38
In an investigation, if the significance level is 0,01 ; what is the confidence level of this study ?
Seçenekler
A
0,01
B
0,05
C
0,50
D
0,95
E
0,99
Açıklama:
In an investigation, if the significance level is 0,01 ; the confidence level is 0,99. The correct answer is E.
Soru 39
In an investigation, if the confidence level is 0,95 ; what is the significance level of this study?
Seçenekler
A
0,01
B
0,05
C
0,50
D
0,95
E
0,99
Açıklama:
In an investigation, if the confidence level is 0,95 ; the significance level of this study is 0,05. The correct answer is B.
Soru 40
In a classroom there are 25 students. Out of these 25 students 10 of them are male. If a hypothesis testing procedure for the population proportion of female students is to be created, what is the value of the sample proportion of the female students?
Seçenekler
A
0.10
B
0.15
C
0.20
D
0.40
E
0.60
Açıklama:
Total = 25 ==> 100 % = 1
Males = 10 ==> 40 % = 0.40
Females = 15 ==> 60 % = 0.60
Males = 10 ==> 40 % = 0.40
Females = 15 ==> 60 % = 0.60
Soru 41
A hypothesis test which is a _________________ that uses sample statistics to test a claim or assumption about the value of a population parameter?
Seçenekler
A
data collection process
B
decision-making process
C
sampling process
D
data cleaning process
E
averaging process
Açıklama:
a hypothesis test which is a decision-making process that uses sample statistics to test a claim or assumption about the value of a population parameter. These claims or assumptions about the population parameter could be known standard values and they may or may not be true. In that case statistical hypothesis testing denotes the formal processes used by statisticians to accept or reject the statistical hypotheses.
Soru 42
What is the third step of hypothesis testing?
Seçenekler
A
Identify the test statistic
B
Take a sample and make the decision
C
Select a level of significance
D
State null and alternate hypotheses
E
Select a level of significance
Açıklama:
To test the claims made about the population parameters or in other words to test the statistical expressions the following steps can be followed:
Step 1: State null and alternate hypotheses
Step 2: Select a level of significance
Step 3: Identify the test statistic
Step 4: Formulate a decision rule
Step 5: Take a sample and make the decision
Step 1: State null and alternate hypotheses
Step 2: Select a level of significance
Step 3: Identify the test statistic
Step 4: Formulate a decision rule
Step 5: Take a sample and make the decision
Soru 43
what is the last step of hypothesis testing?
Seçenekler
A
Select a level of significance
B
Formulate a decision rule
C
Identify the test statistic
D
Take a sample and make the decision
E
State null and alternate hypotheses
Açıklama:
To test the claims made about the population parameters or in other words to test the statistical expressions the following steps can be followed:
Step 1: State null and alternate hypotheses
Step 2: Select a level of significance
Step 3: Identify the test statistic
Step 4: Formulate a decision rule
Step 5: Take a sample and make the decision
Step 1: State null and alternate hypotheses
Step 2: Select a level of significance
Step 3: Identify the test statistic
Step 4: Formulate a decision rule
Step 5: Take a sample and make the decision
Soru 44
How many types of statistical hypotheses are there?
Seçenekler
A
One
B
Two
C
Three
D
Four
E
Five
Açıklama:
Every statistical hypothesis-testing process begins with the statement of a hypothesis. There are two types of statistical hypotheses for each circumstance. These hypotheses are the null hypothesis and the alternative hypothesis which are denoted by H0 and H1 respectively.
Soru 45
Which of the following can be the null hypothesis?
Seçenekler
A
μ= 5000
B
μ != 5000
C
μ > 5000
D
μ < 5000
E
μ <> 5000
Açıklama:
The null hypothesis always show the status quo. Therefore
μ= 5000 is an example for the null hypothesis
μ= 5000 is an example for the null hypothesis
Soru 46
Which sign we are not going to use in one sample hypothesis problems for alternate hypothesis?
Seçenekler
A
≠
B
>
C
>
D
=
E
>=
Açıklama:
= sign is only used for the null hypothesis
Soru 47
If you reject the null hypothesis when the null hypothesis is false, what is the decision?
Seçenekler
A
Type I error
B
Type II error
C
1- β
D
β
E
Correct decision
Açıklama:
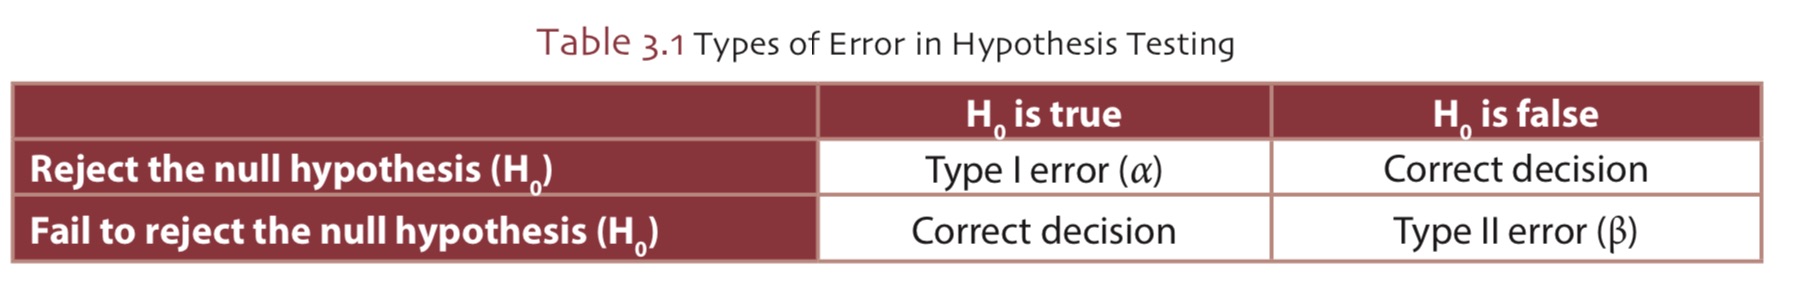
Soru 48
what do we call "P(fail to reject the null hypothesis H0 when it is actually false)"?
Seçenekler
A
Correct decision
B
1-β
C
β + α
D
α
E
β
Açıklama:
through a hypothesis-testing, it is also important to consider the probability of a type II error, failing to reject the null hypothesis (H0) when it is false, which is denoted by β. Then the type II error probability is,
β = P(type I error) = P(fail to reject the null hypothesis H0 when it is actually false)
β = P(type I error) = P(fail to reject the null hypothesis H0 when it is actually false)
Soru 49
what is the total size of the rejection region in hypothesis testing?
Seçenekler
A
1- β
B
H0: μ = μ0
C
H1: μ ≠ μ0
D
1- α
E
α
Açıklama:
If the null hypothesis (H0) is rejected in a hypothesis test with the significance level α then it is said that statistical hypothesis test results are statistically significant at the α level. Determination of the significance level is specifying the rejection probability of the null hypothesis (H0) when it is actually true. The significance level α of a hypothesis test is determined by the researcher before the data collection. Often the level of significance α value of a hypothesis test is selected as 1%, 5% or 10%. When you choose the significance level, on practice, it means that if you repeatedly create many samples from the population in question, 1% of the time your results will not be correct.
Soru 50
if the type I error is 0.05 and a two-sided hypothesis testin is investigated, what is the z value from the standard normal distribution table?
Seçenekler
A
1.96
B
2.18
C
1.65
D
2.33
E
1.88
Açıklama:
0.95 / 2 = 0.4750
search 0.4750 from the table
the answer is 1.96
search 0.4750 from the table
the answer is 1.96
Ünite 4
Soru 1
In order to use Z test statistic for difference between two means, what is the minimum required sample size?
Seçenekler
A
10
B
15
C
20
D
25
E
30
Açıklama:
Z test statistic can be used for difference between two means if sample sizes are greater than or equal to 30. The correct answer is E.
Soru 2
Which of the following is the null hypothesis for the right sided (upper tailed) test ?
Seçenekler
A
H0 : µ1 - µ2 = 0
B
H1 : µ1 - µ2 = 0
C
H0 : µ1 - µ2 < 0
D
H0 : µ1 - µ2 > 0
E
H1 : µ1 - µ2 < 0
Açıklama:
For the right sided (upper tailed) test, the null hypothesis (H0 ) is in the following form:
H0 : µ1 - µ2 = 0
The correct answer is A.
H0 : µ1 - µ2 = 0
The correct answer is A.
Soru 3
What is the rejection region if the alternative hypothesis is in the form of H1 : µ1 < µ2 ?
Seçenekler
A
z > zα
B
z < - zα
C
z > z
D
z > α
E
z > -α
Açıklama:
critical regions for the hypothesis test are summarized as follows; If the alternative hypothesis is in the form of H1 : µ1 ≠ µ2 then rejection region is z > zα/2 or z < - zα/2 If the alternative hypothesis is in the form of H1 : µ1 < µ2 then rejection region is z < - zα If the alternative hypothesis is in the form of H1 : µ1 > µ2 then rejection region is z > zα. Therefore, the correct answer is B.
Soru 4
For the one-way ANOVA test, the test statistic is the ratio of two variances: namely the variance between _______ and the variance within ________.
Which option completes the blanks above?
Which option completes the blanks above?
Seçenekler
A
variables
B
independent variables
C
dependent variables
D
samples
E
hypotheses
Açıklama:
For the one-way ANOVA test, the test statistic is the ratio of two variances: namely the variance between samples and the variance within samples. The correct answer is D.
Soru 5
Which of the following about F Test is true?
Seçenekler
A
The F test to compare more than two population means is always a left tailed test.
B
The F test to compare more than two population means is always a right tailed test.
C
For the F test procedure, the sample sizes need to be equal.
D
If F test statistic value is greater than 1, the alternate hypothesis should be rejected.
E
If F test statistic value is greater than 1, both hypotheses should be rejected.
Açıklama:
For the F test procedure, the sample sizes do not need to be equal.The F (one-way ANOVA) test to compare more than two population means is always a right tailed test. If F test statistic value is greater than 1, the null hypothesis should be rejected. Therefore, the correct answer is B.
Soru 6
An agricultural engineer wants to determine whether there is a difference in the mean yield of three different agricultural ingredients to increase the mean yield of a certain produce in a decares. What is the null hypothesis?
Seçenekler
A
H0 : µ1 ≠ µ2 ≠ µ3
B
H0 : µ1 ≠ µ2 = µ3
C
H0 : µ1≠ µ2
D
H0 : µ1 = µ2
E
H0 : µ1 = µ2 = µ3
Açıklama:
The null hypothesis (H0 ) and alternative hypothesis (H1 ) for the mean yield rate of the produce can be expressed as follows; H0 : µ1 = µ2 = µ3. The correct answer is E.
Soru 7
A road traffic safety research study examined winter tire use in the passenger cars in two nearby cities. Number of the cars examined in city 1 are 100 (n1 ) and 60 of the cars have winter tires. On the other hand, in the city 2,120 (n2 ) passenger cars are examined and 78 of the cars have winter tires. What is the alternate hypothesis?
Seçenekler
A
H1 : p1 = p2
B
H1 : p1 ≠ p2
C
H1 : p1 < p2
D
H1 : p1 > p2
E
H0 : p1 = p2
Açıklama:
In this question, the parameter of interest is the winter tire use proportion in the passenger cars in two nearby cities. The group sizes for the city 1, n1 = 100 and for the city 2, n2 = 120. Then, hypothesis can be expressed as follows: H0 : p1 = p2 H1 : p1 ≠ p2. Therefore, the correct answer is B.
Soru 8
For the means of two normal distributions, what is the null hypothesis for two sided (two tailed) test?
Seçenekler
A
H0 : µ1 - µ2 = 0
B
H0 : µ1 < µ2
C
H0 : µ1 - µ2 = 1
D
H0 : µ1 > µ2
E
H0 : p1 = p2
Açıklama:
For two sided (two tailed) test, the null hypothesis (H0 ) and the alternative hypothesis (H1 ) are in the following form, H0 : µ1 - µ2 = 0 H1 : µ1 - µ2 ≠ 0. The correct answers is A.
Soru 9
In a problem, the variance between samples is 350 and variance within samples is 70. What is the test statistic F according to this information?
Seçenekler
A
0,5
B
5
C
15
D
0,7
E
0,35
Açıklama:
The test statistic for a one-way ANOVA test is the ratio of two variances; namely the variance between samples (MSB) and variance within samples (MSW). Then, the test statistic F can be obtained as follows, F = MSB / MSW.
Then,
F = 350/70 = 5 . The correct answer is B.
Then,
F = 350/70 = 5 . The correct answer is B.
Soru 10
In a problem, the variance between samples is 200 and the test stastic F is 2. What is the variance within samples?
Seçenekler
A
10
B
20
C
60
D
100
E
202
Açıklama:
The test statistic for a one-way ANOVA test is the ratio of two variances; namely the variance between samples (MSB) and variance within samples (MSW). Then, the test statistic F can be obtained as follows, F = MSB / MSW.
Then,
2 = 200/ MSW
So, the variance within samples is 100.
Then,
2 = 200/ MSW
So, the variance within samples is 100.
Soru 11
Which of the given forms of hypothesis equivalently is one that is correct?
Seçenekler
A
H0: µ1 = µ2
H1: µ1 ≠ µ2
H1: µ1 ≠ µ2
B
H0: µ1 = µ2
H1: µ1 = µ2
H1: µ1 = µ2
C
H0: µ1 = µ2
H1: µ1 - µ2 =0
H1: µ1 - µ2 =0
D
H0: µ1 < µ2
H1: µ1 > µ2
H1: µ1 > µ2
E
H0: µ1 - µ2 = 1
H1: µ1 ≠ µ2
H1: µ1 ≠ µ2
Açıklama:
For two sided (two tailed) test, the null hypothesis (H0) and the alternative hypothesis (H1) are in the following form,
H0: µ1 - µ2 = 0
H1: µ1 - µ2 ≠ 0
This hypothesis equivalently can be expressed as,
H0: µ1 = µ2 (There is no difference)
H1: µ1 ≠ µ2 (There is a difference)
The answer is A.
H0: µ1 - µ2 = 0
H1: µ1 - µ2 ≠ 0
This hypothesis equivalently can be expressed as,
H0: µ1 = µ2 (There is no difference)
H1: µ1 ≠ µ2 (There is a difference)
The answer is A.
Soru 12
The population variances for two samples are 2 and 5, the difference of the sample means for these two samples is 3, and the sample sizes are 100 and 500, respectively. For the given values what is the test statistic?
Seçenekler
A
10
B
20
C
30
D
40
E
50
Açıklama:
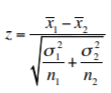 The formula gives the test statistic for two sample tests of means when their population variances are known. since x1 - x2 =3, and the denominator of the formula can be written as {[(2)2/100]+[(5)2/500]}1/2 which would be equal to 0.3. This would yield to z=3/(0.3) = 10
The answer is A
Soru 13
A random sample of 410 from two class in a high school is chosen. 250 of the students is selected from class (A) and their particular subject's mean test score is 70 with a standard deviation of 5. The rest of the students is selected from class (B) and their mean test score is 65 with a standard deviation of 4. At the 1% significance level, can we conclude that class (A) mean test score is better than the class (B)?
Seçenekler
A
20
B
25
C
30
D
35
E
40
Açıklama:
The independent random sample sizes are nA = 250 students and nB = 160 students. Also, the class (A) mean test score is xA = 70 and standard deviation sA = 5, and the class (B) mean test score is xB = 65 and standard deviation sB= 4. Then, the test statistic can be obtained as follows: xA - xB = 70 - 65 = 5, sA2 = 25, sB2 = 16. Therefore [(25/250)+(16/160)] = 1/5. The test statistic z=5/(1/5)=25
The answer is B.
The answer is B.
Soru 14
For sample one the sample size is 10, mean is 4.5, and standard deviation is 1. For sample two the sample size is 12, mean is 3.4, and standard deviation is 1.2 and (µ1 −µ2 ) is considered to be equal to 0. What is the test statistics for the given values?
Seçenekler
A
1
B
5
C
9
D
13
E
17
Açıklama:
Since the sample sizes are smaller than 30 we will use 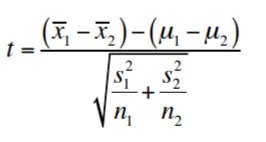 this formula. The numerator is equal to (4.5 - 3.4) - 0 = 1.1. The denominator is equal to [(1)2/10] +[(1.2)2/12] = 0.1+0.12 = 0.22. these results would yield to a test statistic of z=1.1/0.22 = 5
The answer is B.
this formula. The numerator is equal to (4.5 - 3.4) - 0 = 1.1. The denominator is equal to [(1)2/10] +[(1.2)2/12] = 0.1+0.12 = 0.22. these results would yield to a test statistic of z=1.1/0.22 = 5The answer is B.
Soru 15
I. If the alternative hypothesis is in the form of H1: p1α
II. If the alternative hypothesis is in the form of H1: p1>p2 then rejection region is z>zα
II. If the alternative hypothesis is in the form of H1: p1≠p2 then rejection region is z=zα/2
For the given statements about the hypothesis test of the difference between two population proportions which ones can be said to be true?
Seçenekler
A
Only I
B
Only II
C
I and II
D
I and III
E
II and III
Açıklama:
Critical regions for the hypothesis test are summarized below;
If the alternative hypothesis is in the form of H1: p1≠p2 then rejection region is z>zα/2 or z <-zα/2
If the alternative hypothesis is in the form of H1: p1α
If the alternative hypothesis is in the form of H1: p1>p2 then rejection region is z>zα
The answer is C.
If the alternative hypothesis is in the form of H1: p1≠p2 then rejection region is z>zα/2 or z <-zα/2
If the alternative hypothesis is in the form of H1: p1
If the alternative hypothesis is in the form of H1: p1>p2 then rejection region is z>zα
The answer is C.
Soru 16
A chocolate factory is examining the sales of their new brand chocolates in two nearby cities. The number of chocolates sold in city 1 is 300 (n1) and 120 of the chocolates were their new brand chocolates. On the other hand, in the city 2, 240(n2) of the sold chocolates, 150 of them were their new brand chocolates. What is the test statistics? ([(1/300) + (1/240)] can be assumed to be equal to 0.25)
Seçenekler
A
-2.9
B
-1.9
C
-1.6
D
-1.3
E
-0.9
Açıklama:
n1 =300, x1 = 120 then p1 = x1/n1= 120/300= 0.4
n2 =240, x1 = 150 then p2 = x2/n2= 150/240= 0.625
p = (x1 + x2)/(n1 + n2) = (120 + 150)/(240 + 300) =0.5
Then, z-test is used to test the difference between two proportions p1 and p2 and the test statistic is as follows: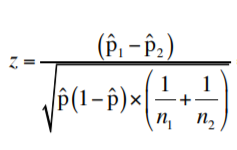 The numarator is 0.4 - 0.625 = -0.225.
0.5x(1-0.5)=0.25, [(1/300)+(1/600)] is assumed to be equal to 0.25 therefore the denominator is 0.25. This yields to z = -0.225/0.25 = -0.9
The answer is E.
n2 =240, x1 = 150 then p2 = x2/n2= 150/240= 0.625
p = (x1 + x2)/(n1 + n2) = (120 + 150)/(240 + 300) =0.5
Then, z-test is used to test the difference between two proportions p1 and p2 and the test statistic is as follows:
The numarator is 0.4 - 0.625 = -0.225.0.5x(1-0.5)=0.25, [(1/300)+(1/600)] is assumed to be equal to 0.25 therefore the denominator is 0.25. This yields to z = -0.225/0.25 = -0.9
The answer is E.
Soru 17
For the variance between samples equalling 10 and the variance within samples equaling 20, what is the test statistic for a one-way ANOVA test is the ratio of two variances?
Seçenekler
A
0.1
B
0.2
C
0.3
D
0.5
E
1.5
Açıklama:
The test statistic for a one-way ANOVA test is the ratio of two variances; namely the variance between samples (MSB) and variance within samples (MSW). Then, the test statistic F can be obtained as follows, F = MSB/MSW. Therefore F=10/20 = 0.5
Soru 18
If for 5 population groups their sum of squares between is equal to 48 and the sum of squares within is equal to 19. The total sample size of the groups is equal to 100, then what is the F test statistics?
Seçenekler
A
30
B
40
C
50
D
60
E
70
Açıklama:
MSB=SSB /d.f.N and MSW=SSW /d.f.D. First we must find the degrees of freedom. d.f.N=5 -1=4 and d.f.D=100 - 5 =95. So this would yield to MSB=48 /4=12 and MSW=19/95 = 0.2. The F statistic is equal to MSB/MSW=12/0.2=60
The answer is D
The answer is D
Soru 19
For Group 1 and Group 2 data that are normally distributed, and the population variances are not equal, we can we conclude that there is a the mean of Group 1 is greater than the mean of Group 2. What is the alternative hypothesis?
Seçenekler
A
H1 : µ1 ≠ µ2
B
H0 : µ1 ≠ µ2
C
H1 : µ1 < µ2
D
H0 : µ1 > µ2
E
H1 : µ1 > µ2
Açıklama:
Since the claim in the question is the first group’s mean is greater than the second group, the alternative hypothesis is right-tailed (right sided). Then the hypothesis can be expressed as follows:
H0 : µ1 = µ2 or H0: µ1 - µ2 = 0
H1: µ1> µ2 or H1: µ1 - µ2 > 0
The answer is E.
H0 : µ1 = µ2 or H0: µ1 - µ2 = 0
H1: µ1> µ2 or H1: µ1 - µ2 > 0
The answer is E.
Soru 20
I. Rejecting the null hypothesis in an ANOVA test means at least one of the means of the
population under consideration is different from the other population means.
II. To compare two means through hypothesis testing procedure which is called one-way analysis of variance (one-way ANOVA) technique used to compare the means of two populations.
III. Rejecting the alternative hypothesis in an ANOVA test means at least one of the means of the population under consideration is different from the other population means.
Which of the given statements about ANOVA test can said to be true?
Seçenekler
A
Only I
B
Only II
C
I and II
D
I and III
E
II and III
Açıklama:
Rejecting the null hypothesis in an ANOVA test means at least one of the means of the
population under consideration is different from the other population means. We consider more than two means and compare them through hypothesis testing procedure which is called as one-way analysis of variance (abbreviated as one-way ANOVA) technique used to compare the means of more than two populations.
The answer is C.
Soru 21
In order to compare more than two means, which of the following statistical analysis can be carried out?
Seçenekler
A
Spearman Rho
B
Pearson Chi-square
C
Paired t-test
D
One-way analysis of variance
E
Tukey's indepence test
Açıklama:
we consider more than two means and compare them through hypothesis testing procedure which is called as one-way analysis of variance (abbreviated as one-way ANOVA) technique used to compare the means of more than two populations.
Soru 22
In an analysis of variance problem, if variance between samples is 45 and variance within samples is 125 then what is the F statistic?
Seçenekler
A
0,36
B
0,15
C
2,78
D
1,14
E
3,48
Açıklama:
F=45/125 = 0,36
Soru 23
Which one of the following is the degrees of freedom for within source of variation in F table?
Seçenekler
A
N-1
B
N-n
C
N-k
D
k-1
E
k-2
Açıklama:
d.f.D = N - k (N is the total sample size of the groups)
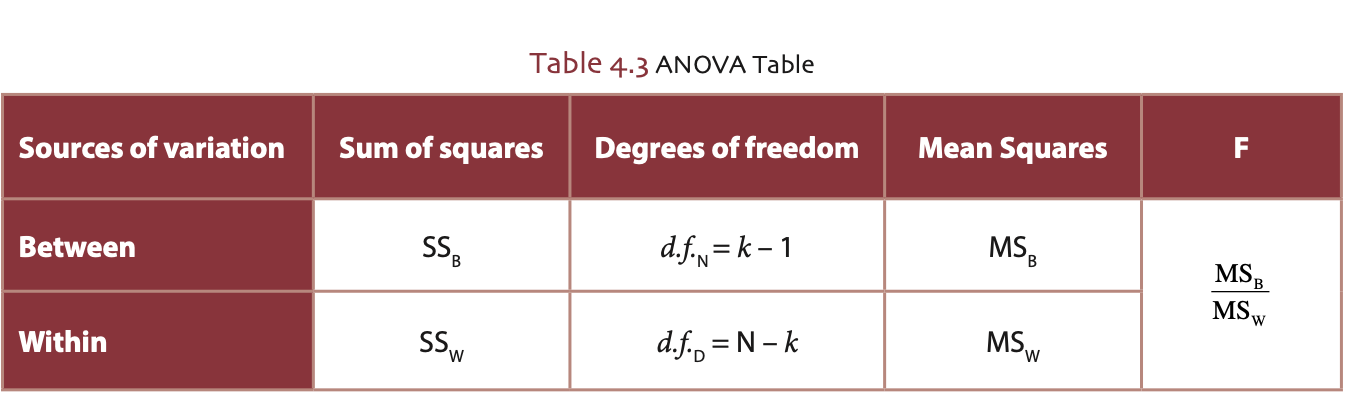
Soru 24
Which one of the following is the degrees of freedom for between source of variation in F table?
Seçenekler
A
k-4
B
k-n
C
k-N
D
N-n
E
k-1
Açıklama:
d.f.N = k - 1 (k stands for the number of groups)
Soru 25
In an F test, if between sum of squares is 48 and the degrees of freedom is 8, what is the between mean squares?
Seçenekler
A
2
B
4
C
6
D
8
E
10
Açıklama:
M.S.(between) = 48/8 = 6
Soru 26
In a one-way analysis of variance the number of groups is 8, what is the degrees of freedom for between source of variation?
Seçenekler
A
6
B
7
C
8
D
14
E
17
Açıklama:
k-1 = 8-1=7
Soru 27
An investigators wants to compare two population proportions. He collects the following information
Population 1 : sample size is 40, observed number of data in sample is 5
Population 2: sample size is 60, observed number of data in sample is 10
What is the overall proportion in this problem?
Population 1 : sample size is 40, observed number of data in sample is 5
Population 2: sample size is 60, observed number of data in sample is 10
What is the overall proportion in this problem?
Seçenekler
A
0,25
B
0,20
C
0,15
D
0,10
E
0,05
Açıklama:
Proportion = (5 + 10) / (40 + 60) =0,15
Soru 28
A scientist found the following statistics for a hypothesis testing of two population proportions:
Population 1 : x1=12, n1=60
Population 2 : x2=30, n2= 90
What is the observed t value in this problem?
Population 1 : x1=12, n1=60
Population 2 : x2=30, n2= 90
What is the observed t value in this problem?
Seçenekler
A
-4
B
-1,78
C
-0,05
D
1,12
E
1,45
Açıklama:
t= (12/60 - 30/90) / kök{(42/150)(1-42/150)*(1/60+1/90)}
t=-1,78
t=-1,78
Soru 29
What is the shaded region indicated by arrows called in hypothesis testing?
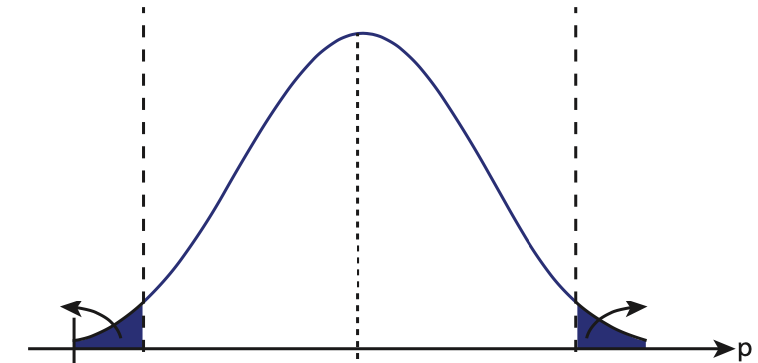
Seçenekler
A
Rejection region
B
Accept region
C
Mean region
D
Variance region
E
Pearson's r
Açıklama:
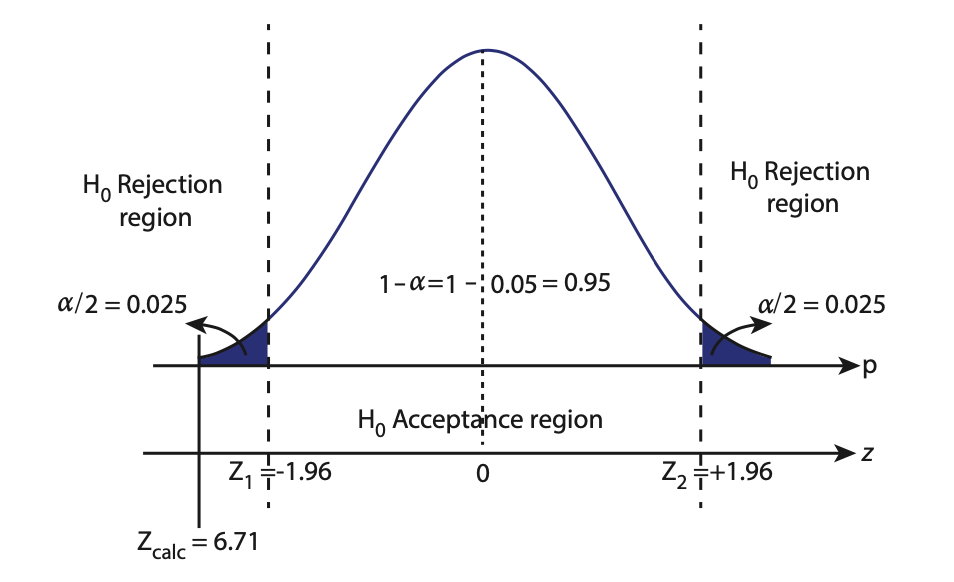
Soru 30
Which one of the following is an example of null hypothesis for testing the means of two normal distribution?
Seçenekler
A
Mean 1 - Mean 2 = 5
B
Mean 1 > Mean 2
C
Mean 1 < Mean 2
D
Mean 1 - Mean 2 >5
E
Mean 1 - Mean 2 = 0
Açıklama:

Soru 31
In which statistical method, we might write down the following hypothesis:
"Is there any difference for the mean number of defective products which are manufactured by two different machine operators?"
"Is there any difference for the mean number of defective products which are manufactured by two different machine operators?"
Seçenekler
A
ANOVA
B
One sample hypothesis testing
C
Regression analysis
D
Hypothesis testing for two populations
E
Kolmogorov-Smirnov
Açıklama:
hypothesis testing problem to two random samples from two different populations to determine whether the population means, or proportions are equal. Some examples for these types of cases are as follows;
Is there any difference for the mean number of defective products which are manufactured by two different machine operators?
Is there any difference of the mean age of customers who are choosing different colours of the same car model?
Is there any difference between the mean exam grade of statistics course taken by economics and management department students?
Is there any difference for the proportion of the student grades which are using two different reference books for the same of course?
Is there any difference for the mean income level of the customers of two different banks?
Soru 32
In two population hypothesis testing which of the following is true?
Seçenekler
A
μ1 >5
B
μ2 < 0
C
μ1 > ( μ2 - 5)
D
μ1 - μ2 = -5
E
μ1 - μ2 = 0
Açıklama:
The null hypothesis can be μ1 - μ2 = 0
Soru 33
For the left sided (lower tailed) test for two population means, how do we write the alternate hypothesis?
Seçenekler
A
μ1 - μ2 =0
B
μ1 > μ2
C
μ1 < μ2
D
μ1
E
μ1 !> μ2
Açıklama:
For the left sided (lower tailed) test, the null hypothesis (H0) and the alternative hypothesis (H1) are in
the following form,
H0: μ1 - μ2 = 0
H1: μ1 - μ2 < 0
This hypothesis equivalently can be expressed as,
H0: μ1 = μ2
H1: μ1 < μ2
the following form,
H0: μ1 - μ2 = 0
H1: μ1 - μ2 < 0
This hypothesis equivalently can be expressed as,
H0: μ1 = μ2
H1: μ1 < μ2
Soru 34
In a two population hypothesis testing problem, population standard deviations are 40 and 30, sample sizes are 125 and 225 respectively. If the z value is calculated, what is the value of denominator for z?
Seçenekler
A
2.7
B
6.597
C
1.879
D
4.099
E
2.658
Açıklama:
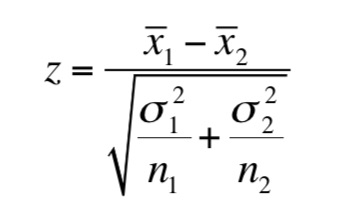
sqrt(40^2/125 + 30^2 / 225) = 4.099
Soru 35
In a two population hypothesis testing problem, the sample arithmetic means are 45 and 80. If the z value is calculated, what is the value of numerator for z?
Seçenekler
A
-15
B
-25
C
-35
D
40
E
70
Açıklama:
the difference is
45 - 80 = -35
Soru 36
The independent random sample sizes are n1 = 180 students and n2 =200 students. Also, the sample mean grades are 80 and 90. Population standard deviations are 20 and 40 respectively. What is the z value for the hypothesis testing?
Seçenekler
A
-3.45
B
-4.59
C
-7.6
D
-0.89
E
-1.82
Açıklama:
(80-90) / sqrt( 20^2/180 + 40^2/200) =-1.82
Soru 37
In a two population hypothesis testing problem, the alternate hypothesis sign is not equal and the level of significance 0.05, what is the theoretical value of z from standard normal distribution?
Seçenekler
A
1.88
B
1.96
C
2.58
D
2.33
E
2.87
Açıklama:
From the standard normal distribution given in the page 79 of your book, the answer is 1.96.
Soru 38
The observed z value is 3.62 and theoretical z value is 1.96, then what is the conclusion for hypothesis testing?
Seçenekler
A
Fail to reject null hypothesis
B
accept null hypothesis
C
accept the alternate hypothesis
D
Fail to accept the alternate hypothesis
E
cant conclude
Açıklama:
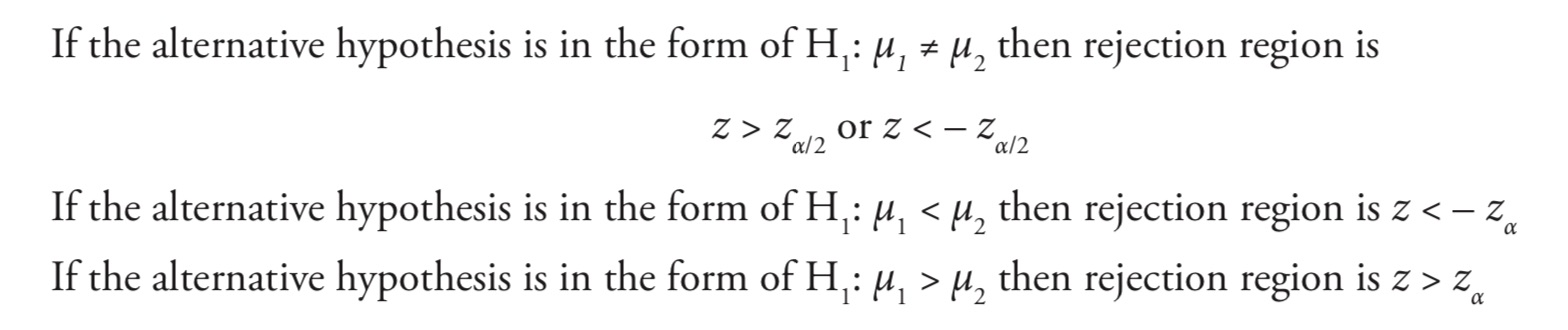
Soru 39
In a two population hypothesis testing problem, if you draw the normal distribution with critical values, what do we call the inside of the critical values?
Seçenekler
A
H0 rejection region
B
Shaded region
C
H1 acceptance region
D
H0 acceptance region
E
No region
Açıklama:
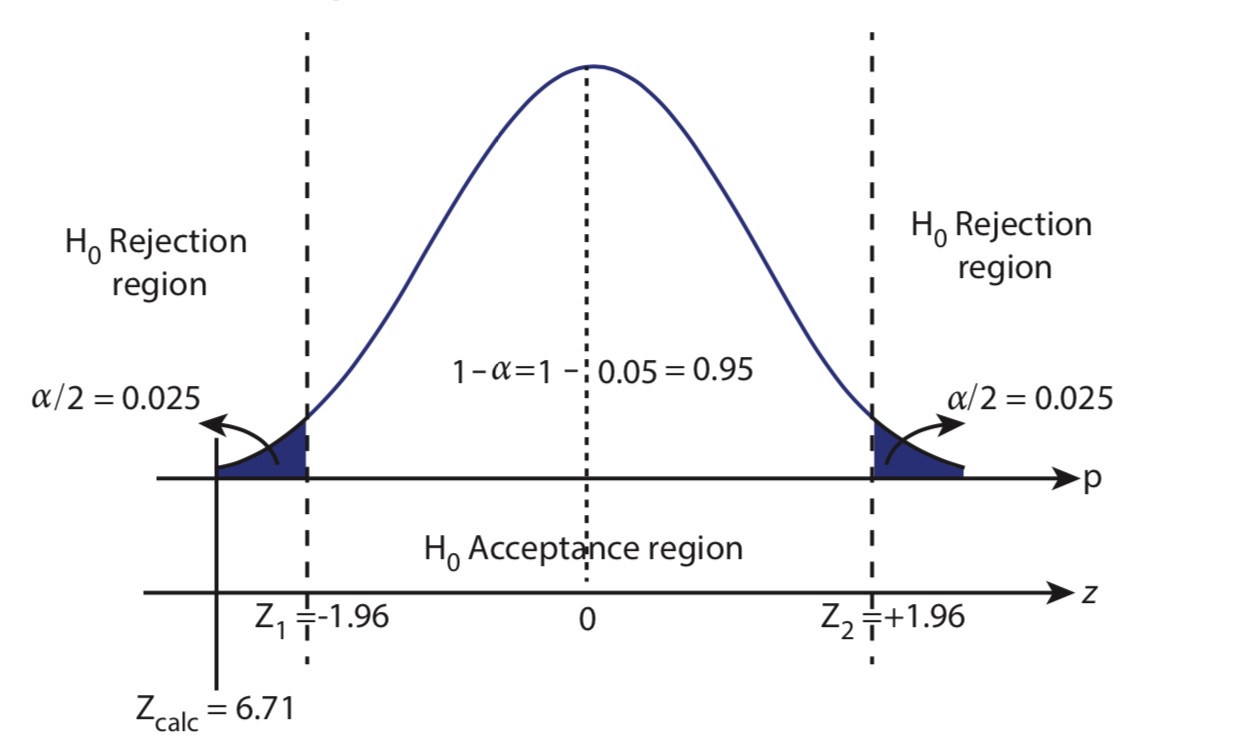
Soru 40
In a two population proportion problem x1 =50; n1=200; x2=120; n2 =400 then what is the value of joint p value?
Seçenekler
A
0.08
B
0.12
C
0.15
D
0.25
E
0.28
Açıklama:
(50 + 120) / (200 + 400) =0.28
Soru 41
A researcher wants to test whether the average exam scores of two student groups (X and Y respectively) are same or not. How will he/she formulate null hypothesis (H0) and alternative hypothesis (H1)?
Seçenekler
A
H0: X1: X>Y
B
H0: Y1: Y>X
C
H0: X=Y, H1: X
D
H0: X=Y, H1: X>Y
E
H0: X=Y, H1: X≠Y
Açıklama:
The null hypothesis is that the average grades are same (X=Y) and the alternative is that they are not same (X≠Y). So the answer is choice E.
Soru 42
Which of the following statements is false regarding the test statistic formula below, which is for two sample tests of means when their population variances are known?
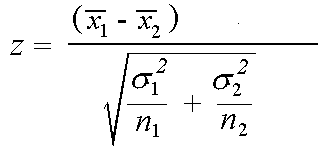
Seçenekler
A
x1-x2 is the difference of the sample mean
B
The sampling distribution is standard normal distribution.
C
σ21, σ22 are known population variances
D
When any of the sample size is larger than 30, then sample variances could be used instead of population variances.
E
n1, n2 are the sizes of the sample of the two independent populations
Açıklama:
In order to use sample variances instead of population variances, both of the sample sizes must be larger than 30. Thus statement in D is false.
Soru 43
A researcher wants to decide whether the average Statistics 101 course exam scores of students of faculty of engineering and faculty of natural sciences are same or not. He takes 60 students from faculty of engineering whose average exam score is 59, and 50 students from faculty of natural sciences whose average score is 65. The variance regarding the exam scores for engineering faculty is 15, and that for natural sciences faculty is 10. What will be the z-statistics for this comparison?
Seçenekler
A
8.94
B
7.62
C
6.45
D
5.63
E
4.86
Açıklama:
so z=(65-59)/(√15/60+10/50)=6/√0.45=8.94Soru 44
Which of the following problems requires a two-sided test?
Seçenekler
A
Chinese men are taller than the Japanese man.
B
Meditterian region olives contain more fat than Aegean region olives.
C
There is no difference between the durations of batteries brand A and brand B.
D
Mercedes cars are consume produce less carbon monoxit than BMW cars do.
E
Cancer risk of men is more than that of women.
Açıklama:
Two sided tests are used for deciding the indifference (equality) of two populations Thus answer is C.
Soru 45
What is the critical z-value for α=0.05?
Seçenekler
A
1.75
B
1.96
C
2.11
D
2.20
E
2.33
Açıklama:
If α=0.05, then the area between z=0 and the critical value of z must be (1-0.05)/2=0.4775, which corresponds to z=1.96
Soru 46
Which test statistic do we use when the population variances are unkonwn and the sample size is smaller than 30?
Seçenekler
A
z-test
B
x-test
C
t-test
D
y-test
E
Chi-test
Açıklama:
t-test is used under such circumtances.
Soru 47
What will be the degrees of freedom for two samples whose sample sizes are "m" and "n" and if the population variances are assumed to be equal for testing the difference between two means?
Seçenekler
A
The smaller of m and n
B
m+n-2
C
m+n-1
D
m+n
E
m+n+1
Açıklama:
If population variances are assumed to be equal then the degrees of freedom=m+n-2.
Soru 48
Assume that there are two different brands (A and B) producing chocolates. The variance of chocolates are assumed to be different. One chooses 10 chococaltes of brand A and 20 chocolates of brand B and observes that the average weight of brand A sample is 56 gr and brand B is 54 gr. The sample variances for A and B are 1 and 2 gr respectively. What will be the t-statistic and can we conclude that the weights of these brands are different at 0.05 significance level?
Seçenekler
A
t=1.65, weight are same
B
t=1.81, weights are same
C
t=2.98, weights are different
D
t=3.34, weights are same
E
t=4.47, weights are different
Açıklama:
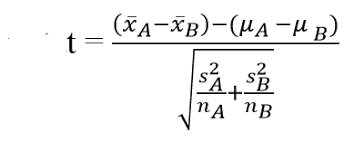 so t=(56-54)/√(1/10+2/20)=2/√0.2=4.47. Degrees of freedom is 9 (since the smaller of 10-1 and 20-1 is 9) since the population variances are different. Thus the critical value of t=1.833. Since the calculated t is bigger than critical value we reject the null hypothesis that brand A and B have same weight. Thus we conclude that their weights differ at 0.05 significance level.
Soru 49
What will be the variance of defect trucks produced by a factory if 10 of every 100 trucks are defect?
Seçenekler
A
0.90
B
0.45
C
0.10
D
0.09
E
0.01
Açıklama:
Variance=p*(1-p)=0.1*0.9=0.09
Soru 50
Which of the following test is used in case of more than two means of population?
Seçenekler
A
F-test
B
Q-test
C
P-test
D
Chi-test
E
Wald test
Açıklama:
F-test is used in such cases.
Ünite 5
Soru 1
Which of the followings looks at the relationship between variables and examines the degree of the relationship if there is any?
Seçenekler
A
Correlation
B
Correlation Coefficient
C
Coefficient of Determination
D
Slope of the Regression Line
E
Multiple Linear Regression
Açıklama:
In general, the correlation analysis looks at the relationship between variables and examines the degree of the relationship if there is any.
Soru 2
In which of the followings all pairwise values of the two continuous variables are plotted in two dimensions?
Seçenekler
A
Simple Linear Regression
B
Multiple Linear Regression
C
Scatterplot
D
Slope of the Regression Line
E
Coefficient of Determination
Açıklama:
CORRELATION
In scatterplot, all pairwise values of the two continuous variables are plotted in two dimensions.
In scatterplot, all pairwise values of the two continuous variables are plotted in two dimensions.
Soru 3
Which of the followings is widely used in order to show the degree of the relationship between two continuous variables?
Seçenekler
A
Pearson’s Correlation Coefficient
B
Coefficient of Determination
C
Slope of the Regression Line
D
Simple Linear Regression
E
Multiple Linear Regression
Açıklama:
In order to show the degree of the relationship between two continuous variables, The Pearson’s correlation coefficient or Pearson’s product moment correlation coefficient is widely used.
Soru 4
Which of the followings represents the population correlation for Pearson’s correlation coefficient?
Seçenekler
A
r
B
rho
C
+1
D
y
E
x‒
Açıklama:
There are two symbols used for Pearson’s correlation coefficient, population correlation is represented by ρ (rho).
Soru 5
Which of the following interpretations is true if the negative value is -1 and the positive value is+1 in the interpretation of Pearson’s Correlation Coefficient?
Seçenekler
A
Perfect correlation
B
Very strong correlation
C
Strong correlation
D
Moderate correlation
E
Weak correlation
Açıklama:
Pearson’s Correlation Coefficient
Perfect correlation
Perfect correlation
Soru 6
Which of the following interpretations is true if the negative value is-0.2 ≥ r > 0.4 in the interpretation of Pearson’s Correlation Coefficient?
Seçenekler
A
Perfect correlation
B
Very strong correlation
C
Strong correlation
D
Moderate correlation
E
Weak correlation
Açıklama:
Table 5.1 Interpretation of Pearson’s Correlation Coefficient
Weak correlation
Weak correlation
Soru 7
Which of the followings measures the proportion of the variance of dependent variable (y), given by independent variable (x), when y is expressed as a linear regression on x in correlation and regression problems?
Seçenekler
A
Pearson’s Correlation Coefficient
B
Coefficient of Determination
C
Slope of the Regression Line
D
Simple Linear Regression
E
Multiple Linear Regression
Açıklama:
In correlation and regression problems, the coefficient of determination measures the proportion of the variance of dependent variable (y), given by independent variable (x), when y is expressed as a linear regression on x. We will study the regression model in the following section.
Soru 8
Which of the followings is the process of creating a model of the linear relationship between independent variable and dependent variable ?
Seçenekler
A
Pearson’s Correlation Coefficient
B
Coefficient of Determination
C
Slope of the Regression Line
D
Simple Linear Regression
E
Multiple Linear Regression
Açıklama:
SIMPLE LINEAR REGRESSION
The process of creating a model of the linear relationship between independent variable and dependent variable is called as the regression analysis
The process of creating a model of the linear relationship between independent variable and dependent variable is called as the regression analysis
Soru 9
Which of the followings represents random error in simple linear regression model?
Seçenekler
A
yi
B
xi
C
εi
D
β
E
α and β
Açıklama:
SIMPLE LINEAR REGRESSION
εi
εi
Soru 10
In which of the following models the constant of simple linear regression α is represented by β0?
Seçenekler
A
Pearson’s Correlation Coefficient
B
Coefficient of Determination
C
Slope of the Regression Line
D
Simple Linear Regression
E
Multiple Linear Regression
Açıklama:
in multiple linear regression, the constant of simple linear regression α is represented by β0.
Soru 11
"The correlation analysis_____" Which of the following best completes the sentence above?
Seçenekler
A
works on the situations in which the variables are strictly qualitative and recently measured
B
looks at the relationship between variables and examines the degree of the relationship if there is any
C
does not require the variables under investigation to be continuous variables for better results
D
does not use any data graph to understand the relationship between the variables
E
has been designed to test if there is a relationship between some variables
Açıklama:
In general, the correlation analysis looks at the relationship between variables and examines the degree of the relationship if there is any. If you remember from the previous chapters, in order to understand the relationship between the variables, the simplest thing we might do is to create a graph of the data, specifically a scatterplot of the variables. In correlation analysis, in this chapter, the variables under investigation are continuous variables. We are not going to study the situations where the variables are strictly qualitative (such as eye colours, type of car etc.).
Soru 12
Which of the following is not true?
Seçenekler
A
The scatterplot gives an indication that there may or may not be a relationship between two variables.
B
Once a scatterplot indicates a relationship, we should measure the degree of the relationship by using statistical techniques
C
There are different techniques to show the degree of the relationship between two variables
D
Once scatterplots are used, the degree of the relationship is always difficult to measure in quantitative data
E
The scatterplots could be used to work on continuous variables
Açıklama:
The scatterplot gives an indication that there may or may not be a relationship between two variables. The important part is that once a scatterplot indicates a relationship, we should measure the degree of the relationship by using statistical techniques. There are different techniques to show the degree of the relationship between two variables; but in this chapter, we will only pay attention to the situation where two variables in concern are continuous variables.
Soru 13
What is the interpretation of Pearson’s Correlation Coefficient values "-0.8 ≥ r ≥ 0.99"?
Seçenekler
A
Perfect correlation
B
Very strong correlation
C
Strong correlation
D
Moderate correlation
E
Weak correlation
Açıklama:
Interpretation of Pearson’s Correlation Coefficient
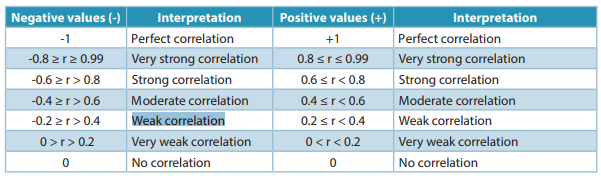
Soru 14
What is the interpretation of Pearson’s Correlation Coefficient values "0 < r < 0.2"?
Seçenekler
A
Strong correlation
B
Moderate correlation
C
Weak correlation
D
Very weak correlation
E
No correlation
Açıklama:
Interpretation of Pearson’s Correlation Coefficient
Soru 15
Which of the following statements is true about "H0:ρ=0"?
Seçenekler
A
Correlation cannot be measured
B
Correlation is insignificant
C
There is no correlation
D
There is a correlation
E
Population correlation is not zero
Açıklama:
H0:ρ=0 (There is no correlation. Population correlation is zero)
H1:ρ≠0 (There is a correlation. Population correlation is not zero)
H1:ρ≠0 (There is a correlation. Population correlation is not zero)
Soru 16
Which of the following is not true about the simple linear regression model 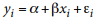
Seçenekler
A 
B 
C 
D 
E 
Açıklama:
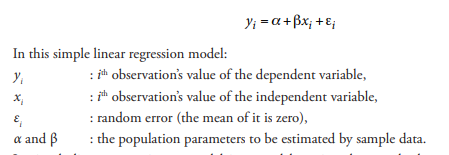
Soru 17
Which of the following is not one of the assumptions in a linear regression model?
Seçenekler
A 
B
The variance of the residuals at all levels of independent variable is not constant
C 
D 
E 
Açıklama:
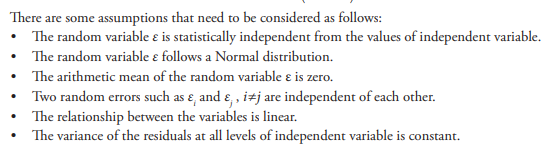
Soru 18
In an investigation, the monthly electricity consumption (kw) of a family of four is estimated by the size of the house (in meter squares). It is going to be a big project, but the investigator creates a pilot study with 10 family homes in a small town. Here are the data values below;
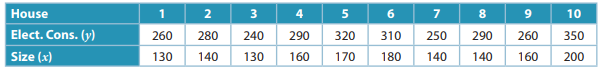 Which of the following is the simple linear regression model for the case above?
Which of the following is the simple linear regression model for the case above?Seçenekler
A 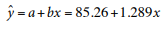
B 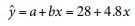
C 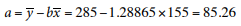
D 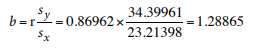
E 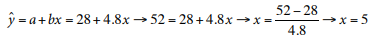
Açıklama:
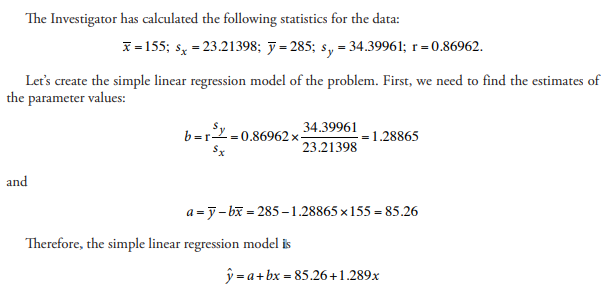
Soru 19
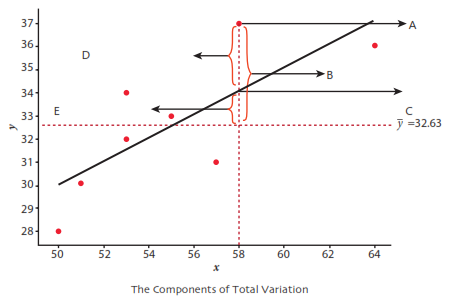 What is A in the graph above?
Seçenekler
A
Explained variable
B
Unexplained variation
C
Estimate
D
Observation
E
Total variation
Açıklama:
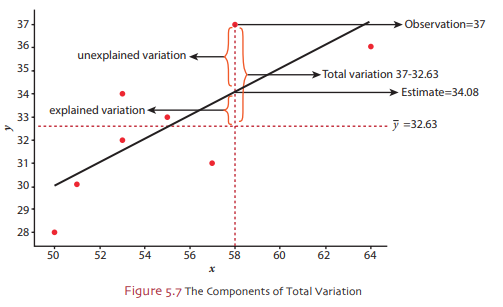
Soru 20
Which of the following is not true about the multiple linear regression model ?
?
Seçenekler
A 
B 
C  the observation parameters
D 
E 
Açıklama:
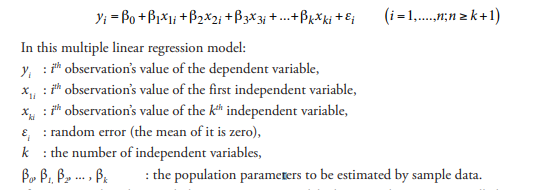
Soru 21
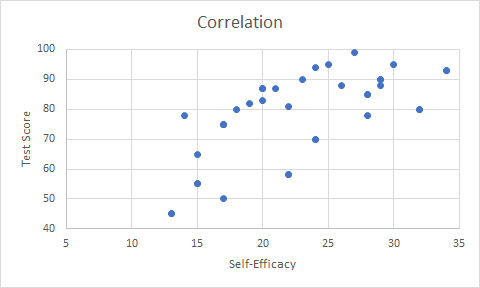 What might be the correlation coefficient according to that graph?
Seçenekler
A
0.65
B
-0.30
C
0.20
D
1
E
-0.70
Açıklama:
For detailed information, please review Correlation part at page 101.
As the self-efficacy values increases, achievement values increases too. So, it is called a positive relationship. Secondly, it is obvious that the relationshio is neither perfect nor too weak. So we can say that it is moderate.
So, we can choose the option A since it indicates a positive and moderate relationship.
Soru 22
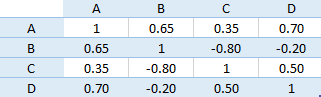 The table given above indicates the correlation coefficients between A, B, C and D variables. According to those correlations, which one of the following statement is wrong?
Seçenekler
A
As the values of A decreases, values of D decreases, too.
B
The relationship between B-C is stronger than the relationship between B-D.
C
C and D have a moderate positive relationship.
D
The weakest relationship is between A and C.
E
The strongest relationship is between B and C.
Açıklama:
Please review Correlation part at page 101 for detailed information.
The weakest relationship is between B and D.
The weakest relationship is between B and D.
Soru 23
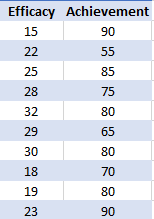 A teacher wants to investigate whether there is a relationship between students' self-efficay and their exam results. 10 students were randomly picked up and their values were recorded and given in the table above. What is the Pearson correlation coefficient between students' self-efficacy scores and their achievement?
Seçenekler
A
0.86
B
-0.14
C
0.35
D
-0.54
E
0.25
Açıklama:
Please review Page 105 for detailed information.
Pearson Correlation Coefficient formula is given in page 105. You can use and calculate the coefficient as -0.14.
Pearson Correlation Coefficient formula is given in page 105. You can use and calculate the coefficient as -0.14.
Soru 24
If the independent variable explains the 48% of the variability of the dependent variable, what might be the correlation coefficient between this independent and dependent variables?
Seçenekler
A
0.31
B
0.72
C
-0.69
D
0.48
E
-0.28
Açıklama:
Please review Coefficient of Determination part on page 108.
0.48 is the coefficient of determination. The coefficient of determination is calculated by using the square of Pearson’s correlation coefficient. So if we get the squareroot of it, we can find the correlation coefficient.
0.48 is the coefficient of determination. The coefficient of determination is calculated by using the square of Pearson’s correlation coefficient. So if we get the squareroot of it, we can find the correlation coefficient.
Soru 25
In a significance test for Pearson correlation coefficient, it is known that the null hypothesis “Population correlation is zero” is rejected. What might be the correlation coefficient? (Number of observation is 10)
Seçenekler
A
0.32
B
0.45
C
0.53
D
0.60
E
0.69
Açıklama:
Please review the page 109 Significance Test for Pearson’s Correlation Coefficient
t(8;0.05) = 2.306.
If absolute value of the observed t statistics is greater than 2.306, we should reject the Ho.
 If we solve the equation, we get 0.63 for the critical r value. The r values less than 0.63 result in an observed t less than 2.306.
So it should be greater than 0.63
t(8;0.05) = 2.306.
If absolute value of the observed t statistics is greater than 2.306, we should reject the Ho.
So it should be greater than 0.63
Soru 26
Assume that the standard deviations of dependent and independent variables are 2.30 and 1.25 respectively. Besides their correlation coefficient is 0.60. What might be the possible regression model for those variables?
Seçenekler
A
Y= 2.30 + 1.25X
B
Y= 15 + 2.30X
C
Y= 12 + 0.60X
D
Y= 10 + 1.10X
E
Y= 18 + 0.54X
Açıklama:
Please review page 113.
 That formula given in page 113 states that, the standart deviations of Y and X and the correlation of them can be used to find the slope of regression equestion. According to our question, the slope is calculated and it is 1.10.
So the only alternative had 1.10 as slope is D.
That formula given in page 113 states that, the standart deviations of Y and X and the correlation of them can be used to find the slope of regression equestion. According to our question, the slope is calculated and it is 1.10.So the only alternative had 1.10 as slope is D.
Soru 27
If it is known that the correlation of two variables is -0.49, which of the following statements is true?
Seçenekler
A
As one of the variables decreases, the other one decreases, too.
B
There is a positive relationship between them.
C
%49 of the variation of independent varible can be explained by the dependent variable.
D
%24 of the variation of dependent varible can be explained by the independent variable.
E
%70 of the variation of independent varible can be explained by the dependent variable.
Açıklama:
Review page 108, Coefficient of Determination part.
The coefficient of determination measures the proportion of the variance of dependent variable (y), given by independent variable (x) and calculated by r^2.
The coefficient of determination measures the proportion of the variance of dependent variable (y), given by independent variable (x) and calculated by r^2.
Soru 28
Y=5-2.4X
According to the given simple linear regression model, which of the following statement is false?
According to the given simple linear regression model, which of the following statement is false?
Seçenekler
A
The one unit change in X results in 2.4 unit change in Y.
B
As X values increase, Y values decrease.
C
The constant term of regression equation is 5.
D
The slope of equation is 2.4.
E
When X=0, the regression line intersects the Y axis at -2.4.
Açıklama:
Please review the Simple Linear Regression part at page 111.
When X=0, the regression line intersects the Y axis at 5.
When X=0, the regression line intersects the Y axis at 5.
Soru 29
Y=a + bX
What does b indicates on that regression model?
What does b indicates on that regression model?
Seçenekler
A
Slope
B
Error term
C
Constant
D
Average
E
Intercept
Açıklama:
Please review page 111.
It is slope.
It is slope.
Soru 30
Seçenekler
A
X1 has a negative correlation with Y.
B
As X2 increases one unit, Y decreases 0.8 unit.
C
As X3 increases one unit, Y decreases 1.2 unit.
D
The slope of the equation is 15.
E
There are 2 independent variables at the model.
Açıklama:
Please review page 123, Multiple Linear Regression part.
The answer is B.
There are 3 independent variables at the equation.
X1 and X3 have a positive correlation with Y, while X2 has a negative one.
The answer is B.
There are 3 independent variables at the equation.
X1 and X3 have a positive correlation with Y, while X2 has a negative one.
Soru 31
How do you measure the degree of a relationship between two continuous variables?
Seçenekler
A
Correlation
B
Variance
C
Mean
D
Mode
E
Mc-Nemar
Açıklama:
In general, the correlation analysis looks at the relationship between variables and examines the degree of the relationship if there is any.
Soru 32
If the correlation between two variables is 0, which one of the following is true?
Seçenekler
A
There is a correlation
B
There is a week negative correlation
C
There is moderate positive correlation
D
There is a strong negative correlation
E
There is no correlation
Açıklama:
It means there is no correlation
Soru 33
If there is a positive perfect correlation between two variables, what is the value of the correlation coefficient?
Seçenekler
A
0
B
0.20
C
0.40
D
0.50
E
1
Açıklama:
1 represents positive perfect correlation between two variables
Soru 34
If the correlation coefficient is 0.50 which one of the following is true?
Seçenekler
A
Perfect correlation
B
Very strong correlation
C
Strong Correlation
D
Moderate correlation
E
Weak correlation
Açıklama:
It shows that there is a moderate correlation
Soru 35
If the correlation between two variable is defined as very weak positive correlation, which one of the following correlation value is possible?
Seçenekler
A
0.18
B
0.30
C
0.45
D
0.50
E
0.75
Açıklama:
Very weak correlation is defined as
0 < r < 0.2, therefore 0.18 is the answer.
0 < r < 0.2, therefore 0.18 is the answer.
Soru 36
If the correlation between two variables is 0.75, what is the coefficient of determination in this problem?
Seçenekler
A
0.4545
B
0.5625
C
0.6545
D
0.7525
E
0.8545
Açıklama:
0.75 * 0.75 = 0.5625
Soru 37
What is the coefficient of determination if the correlation is 0.4?
Seçenekler
A
0.08
B
0.16
C
0.41
D
0.58
E
0.61
Açıklama:
0.40 * 0.40 = 0.16
Soru 38
In the significance test for Pearson's correlation coefficient, the following values are found: n=15, r=0.45. What is the observed statistic t for the sample information?
Seçenekler
A
1.021
B
1.278
C
1.458
D
1.745
E
1.816
Açıklama:
t= 0.45*sqrt((15-2)/(1-0.45^2))=1.816
Soru 39
In a simple linear regression model, the arithmetic mean of the independent variable is 60, arithmetic mean of the dependent variable is 140, and b=1.25. What is the value of "a" for this simple linear regression model?
Seçenekler
A
35
B
35
C
55
D
65
E
75
Açıklama:
a= 140 - 1.25 * 60 =65
Soru 40
The estimated simple linear regression model is y= 65 + 2.45 * x, what is the y value according to model if x=12?
Seçenekler
A
71.93
B
82.83
C
95.73
D
102.65
E
94.40
Açıklama:
y= 65 + 2.45 * 12 = 65 + 29.40 = 94.40
Soru 41
In general, the correlation analysis looks at the relationship between variables and examines the degree of the relationship if there is any. Which of following presents the reverse relationship between the values of the variables?
Seçenekler
A
Nonlinear relationship
B
Positive relationship
C
Negative relationship
D
Circular relationship
E
Pessimistic relationship
Açıklama:
If the change of the values of two variables is synchronised with each other then we have a positive relationship, if there is a reverse relationship between the values of the variables, then we have a negative relationship. The answer is C.
Soru 42
- It shows the degree of the relationship between two continuous variables
- It uses the ρ (rho) symbols.
- It gets values between -1 and +1.
Seçenekler
A
Linear Correlation Analysis
B
Pearson’s Correlation Coefficient
C
Regression Analysis
D
Exponential Coefficient
E
Slope Analysis
Açıklama:
In order to show the degree of the relationship between two continuous variables, The Pearson’s correlation coefficient or Pearson’s product moment correlation coefficient is widely used. There are two symbols used for Pearson’s correlation coefficient, population correlation is represented by ρ (rho) and sample correlation is represented by r. Pearson’s correlation coefficient gets values between -1 and +1. The answer is B.
Soru 43
In a relationship examination between two variables, if the Pearson's coefficient is find as 0.90, which of the following expresses this value?
Seçenekler
A
Between the variables, there is a weak linear relationship
B
Between the variables, there is no relationship
C
Between the variables, there is a strong negative relationship
D
Between the variables, there is a strong positive relationship
E
Can not be say anything without having the data
Açıklama:
According to the result, there is a very strong relationship between the variables. The answer is D.
Soru 44
According to a correlation relationship between two variables, if the coefficient of determination is 0.50, which of the following represents the meaning of this value?
Seçenekler
A
The independent variable in the situation explains half of the variability of the dependent variable.
B
The independent variable in the situation explains the 7% of the variability of the dependent variable.
C
There is a moderate linear relationship between the variables.
D
There is a negative linear relationship between the variables.
E
The dependent variable in the situation explains the 50% of the variability of the dependent variable.
Açıklama:
The practical meaning of the result can be written as follows: “the independent variable in this problem explains the 50% (half) of the variability of the dependent variable”. The answer is A.
Soru 45
In a correlation investigation, if we don't consider the two variables and we are dealing with two different population, which statistical term is come up?
Seçenekler
A
Linearity test for Pearson’s correlation coefficient
B
Regression test for Pearson’s correlation coefficient
C
Significance test for Pearson’s correlation coefficient
D
Test of "r"
E
Test of "pearson"
Açıklama:
In order to decide if there is a correlation between the population parameters of two continuous variables, we use sample information. We can test the null hypothesis of “population correlation is equal to 0”, or “there is no correlation between two variables” by using sample correlation coefficient. In this case, we will use the t distribution with n-2 degrees of freedom and with a specific significance level (α). In order to use this hypothesis testing, we assume that the underlying distributions of the two variables are Normal distributions. The hypothesis are constituted in the significance test for Pearson’s correlation coefficient. The answer is C.
Soru 46
Which of the following represents the amount of variability in the dependent variable that cannot be explained by the linear relationship between independent and dependent variables?
Seçenekler
A
Coefficient of the independent variable
B
Slope of the regression line
C
The mean of the dependent variable
D
Interception of the regression line
E
Random error ε
Açıklama:
In the model, the random error ε represents the amount of variability in the dependent variable that cannot be explained by the linear relationship between independent and dependent variables. The answer is E.
Soru 47
In a simple linear regression model, if the equation is as follow,
y= 5 + (3.5)x
which of following is the mean of the value of "3.5"?
y= 5 + (3.5)x
which of following is the mean of the value of "3.5"?
Seçenekler
A
Slope of the regression line
B
Error value
C
Intercept of the regression line
D
The value of "t"
E
The value of "r"
Açıklama:
y= 5 + (3.5)x,
3.5 is the slope of the regression line. The answer is A.
3.5 is the slope of the regression line. The answer is A.
Soru 48
In a simple linear regression model, if the equation is as follow,
y= 5 + (3.5)x
Which of the following can be accepted as a true expression?
y= 5 + (3.5)x
Which of the following can be accepted as a true expression?
Seçenekler
A
There is a positive exponential relationship between the variables
B
There is a negative relationship between the variables
C
Without having the data, it can not be say anything.
D
While "x" increases, "y" increases more.
E
While "x" increases, "y" will remain at the same value.
Açıklama:
According to the regression equation, while "x" increases, "y" increases more. The answer is D.
Soru 49
Which of the following represents the sum of the explained variation and unexplained variation?
Seçenekler
A
Partial variation
B
Total variation
C
Related variation
D
Dependent variable
E
Independent variable
Açıklama:
The total variation in a regression problem is equal to the total of explained and unexplained variation in the model and can be written as follows:
The total variation = explained variation + unexplained variation SST=SSR+SSE
The answer is B.
The total variation = explained variation + unexplained variation SST=SSR+SSE
The answer is B.
Soru 50
According to a simple linear regression model for a problem with two variables, the total variation in the model is partitioned as follows:
SSR=100
SSE=120
What is the value of the coefficient of determination for these values?
SSR=100
SSE=120
What is the value of the coefficient of determination for these values?
Seçenekler
A
10
B
12
C
50
D
35
E
45
Açıklama:
Since the components of the total variation is already given then the coefficient of determination is as follows:
the answer = explained variation/total variation = 100/(100+120) = 0.45
Therefore, we can say that the 45% of the variability in the dependent variable can be accounted to the independent variable.
The answer is E.
the answer = explained variation/total variation = 100/(100+120) = 0.45
Therefore, we can say that the 45% of the variability in the dependent variable can be accounted to the independent variable.
The answer is E.
Soru 51
If there are more than 1 independent variables in a regression analysis, what do we call the general model?
Seçenekler
A
Simple linear regression
B
Quadratic regression
C
Correlation
D
Multiple linear regression
E
Additivity
Açıklama:
we will extend the regression model to the case where there are two or more independent variables to explain the relationship with one dependent variable.
In multiple linear regression, there are observed values of k (k≥2) independent variables, with n observations, like x1= x1, x12, x13, ..., x1n ; x2= x21, x22, x23, ..., x1n ; ... ; xk = xk1, xk2 xk3 , ..., xkn.
In multiple linear regression, there are observed values of k (k≥2) independent variables, with n observations, like x1= x1, x12, x13, ..., x1n ; x2= x21, x22, x23, ..., x1n ; ... ; xk = xk1, xk2 xk3 , ..., xkn.
Soru 52
if there are k independent variables in multiple linear regression, how many dependent variable we could have?
Seçenekler
A
One
B
Three
C
k-1
D
k+1
E
N-k
Açıklama:
There is also the values of one dependent variable, y= y1, y2, y3, ..., yn.
Soru 53
In The Analysis of Variance Table in Multiple Linear Regression, what is the degrees of freedom if the source of variation is regression?
Seçenekler
A
1
B
1-n
C
k
D
k+1
E
N-1
Açıklama:
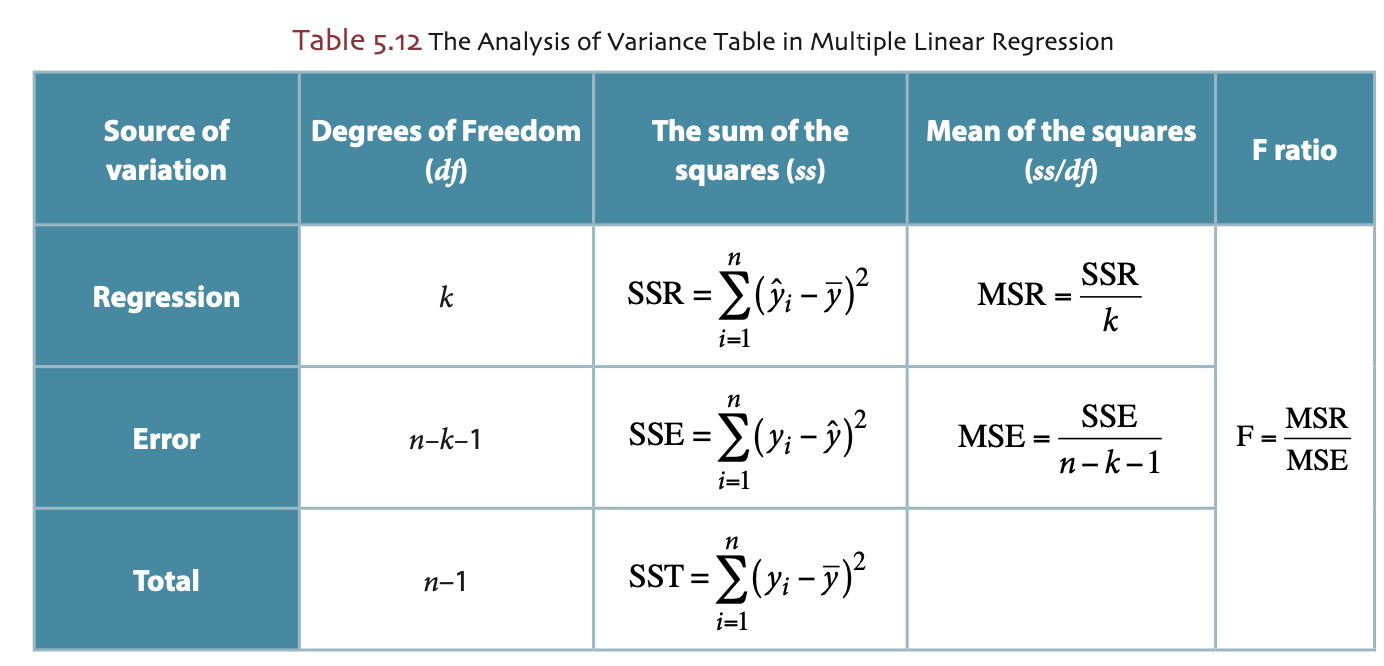
Soru 54
In The Analysis of Variance Table in Multiple Linear Regression, what is the degrees of freedom if the source of variation is error?
Seçenekler
A
k
B
k-1
C
N-1
D
N-k-4
E
n-k-1
Açıklama:
Soru 55
If the SSR in multiple regression model is 125 and k=5, then what is MSR?
Seçenekler
A
15
B
25
C
35
D
45
E
55
Açıklama:
MSR=SSR/k=125/25=5
Soru 56
If the SSE in multiple regression model is 150, k=5, and n=50, then what is MSE?
Seçenekler
A
1,983
B
2,845
C
3,409
D
9,678
E
4,569
Açıklama:
MSE = (150)/(50-5-1)=3,409
Soru 57
If SSR = 125 and SSE=248, then what is SST?
Seçenekler
A
123
B
259
C
319
D
373
E
402
Açıklama:
SST=SSR+SSE=125+248=373
Soru 58
In multiple linear regression if SSR=235 and SST=500, what is the coefficient of determination?
Seçenekler
A
0,17
B
0,27
C
0,37
D
0,47
E
0,57
Açıklama:
C.D.=SSR/SST=0,47
Soru 59
In a simple linear regression analysis, the correlation coefficient is 0.40, what is the coefficient of determination?
Seçenekler
A
0.06
B
0.12
C
0.16
D
0.25
E
0.59
Açıklama:
C.D. = r^2=0.40^2=0.16
Soru 60
The variation that is obtained from the simple linear regression model by the predicted ŷ values is called _________ ?
Seçenekler
A
Mean
B
The total variation
C
variance
D
unexplained variation
E
explained variation
Açıklama:
The variation that is obtained from the simple linear regression model by the predicted ŷ values is called the explained variation (SSR)
Ünite 6
Soru 1
X is 18, Y is 30. What is the simple index number of X compared to Y?
Seçenekler
A
60
B
125
C
400 / 9
D
225
E
500
Açıklama:
x = (18 / 30) . 100 = 60. pg. 135. Correct answer is A.
Soru 2
Monthly sales of companies X and Y are 30 units and 40 units, respectively. What is the index for X compared to Y?
Seçenekler
A
1.200
B
400 / 7
C
300 / 7
D
400 / 3
E
75
Açıklama:
x = (30 / 40) . 100 = 75 . pg. 135. Correct answer is E.
Soru 3
Price of X is 10, and 8 units on January, and April, respectively. January is the base period. What is the fixed based simple price index for April?
Seçenekler
A
800
B
200
C
125
D
80
E
20
Açıklama:
x = (8 / 10) . 100 = 80. pg. 138. Correct answer is D.
Soru 4
Price of X is 3, 4, and 2 units on March, April, and May, respectively. What is the chain-based simple price index for April?
Seçenekler
A
75
B
400 / 3
C
50
D
80
E
200
Açıklama:
x = (4 / 3) . 100. pg. 140. Correct answer is B.
Soru 5
Total price for products group A is 10 and 12 units for months X and Y, respectively. What is the simple aggregate price index for A for month X when month Y is the base?
Seçenekler
A
220
B
150
C
500 / 11
D
250 / 3
E
80
Açıklama:
x = (10 / 12) . 100 = 250 / 3.. pg. 142 . Correct answer is D.
Soru 6
Total price for products group A is 20 and 18 units for weeks X and Y, respectively. What is the fixed based simple average price index for A for week X when week Y is the base?
Seçenekler
A
90
B
100 / 9
C
100 / 19
D
19
E
25
Açıklama:
x = (20 / 18) . 100 = 100 / 9. pg. 143. Correct answer is B.
Soru 7
Total price and quantity for products group A is 14 and 5, and 25 and 4, as unit a and unit b, for months X and Y, respectively. What is the Laspeyres' price index for A for month X when month Y is the base?
Seçenekler
A
19.5
B
125 / 7
C
56.0
D
70.0
E
95.0
Açıklama:
x = ((14. 5) / (25 . 4)) . 100 = (70 / 100) . 100 = 70 . pg. 145. Correct answer is D.
Soru 8
Total price and quantity for products group A is 5 and 18, and 10 and 20, as unit a and unit b, for years X and Y, respectively. What is the Paasche’s price index for A for year X when year Y is the base?
Seçenekler
A
25
B
45
C
50
D
90
E
200
Açıklama:
x = ((5 . 18) / (10 . 20)) . 100 = (90 / 200) . 100 = 45 . pg. 147. Correct answer is B.
Soru 9
Total price and quantity for products group A is 4 and 33, and 5 and 40, as unit a and unit b, for years X and Y, respectively. What is the Fisher’s price index for A for year X when year Y is the base?
Seçenekler
A
200.0
B
132.0
C
66.0
D
33.0
E
16.5
Açıklama:
Fisher's index = (Laspeyres' index . Paashe's index)1/2 ; for this case : Laspeyres' index . Paashe's index = Fisher's index ; x = ((4 . 33) / (5 . 40)) . 100 = (132 / 200) . 100 = 66 . pg. 149. Correct answer is C.
Soru 10
Total price and quantity for products group A is 4 and 50, and 6 and 24, as unit a and unit b, for years X and Y, respectively. What is the Fisher’s price index for A for year Y when year X is the base ?
Seçenekler
A
200
B
144
C
36
D
72
E
125 / 9
Açıklama:
Fisher's index = (Laspeyres' index . Paashe's index)1/2 ; for this case : Laspeyres' inden . Paashe's index = Fisher's index ; x = ((6 . 24) / (4 . 50)) . 100 = (144 / 200) . 100 = 72 . pg. 149. Correct answer is D.
Soru 11
X is 51, Y is 170. What is the simple index number of X compared to Y?
Seçenekler
A
3.33
B
30
C
119
D
221
E
442
Açıklama:
x = (51 / 170) . 100 = 30
Soru 12
Monthly sales of companies X and Y are 45 units and 72 units, respectively. What is the index for X compared to Y?
Seçenekler
A
1.6
B
500 / 9
C
400 / 9
D
62.5
E
31.25
Açıklama:
x = (45 / 72) . 100 = 62.5
Soru 13
Price of X is 56, and 84 units on February, and May, respectively. January is the base period. What is the fixed based simple price index for May?
Seçenekler
A
20
B
30
C
150
D
200 / 3
E
140
Açıklama:
x = (84 / 56) . 100 = 150
Soru 14
Price of X is 4, 8, and 6 units on January, May, and June, respectively. What is the chain-based simple price index for May?
Seçenekler
A
200
B
50
C
75
D
32
E
200 / 3
Açıklama:
x = (8 / 4) . 100 = 200
Soru 15
Total price for products group A is 14 and 16 units for months X and Y, respectively. What is the simple aggregate price index for A for month X when month Y is the base?
Seçenekler
A
224
B
30
C
400 / 3
D
250 / 7
E
87.5
Açıklama:
x = (14 / 16) . 100 = 87.5
Soru 16
Total price for products group A is 27 and 24 units for weeks X and Y, respectively. What is the fixed based simple average price index for A for week X when week Y is the base?
Seçenekler
A
112.5
B
100 / 9
C
100 / 19
D
19
E
25
Açıklama:
x = (27 / 24) . 100 = 112.5
Soru 17
Total price and quantity for products group A is 4 and 15, and 5 and 4, as unit a and unit b, for months X and Y, respectively. What is the Laspeyres' price index for A for month X when month Y is the base?
Seçenekler
A
21.5
B
140 / 9
C
64.0
D
80.0
E
50.0
Açıklama:
x = ((4 . 15) / (5 . 24)) . 100 = (60 / 120) . 100 = 50
Soru 18
Total price and quantity for products group A is 15 and 8, and 25 and 6, as unit a and unit b, for years X and Y, respectively. What is the Paasche’s price index for A for year X when year Y is the base?
Seçenekler
A
250
B
150
C
80
D
60
E
45
Açıklama:
x = ((15 . 8) / (25 . 6)) . 100 = (120 / 150) . 100 = 80
Soru 19
Total price and quantity for products group A is 34 and 3, and 80 and 5, as unit a and unit b, for years X and Y, respectively. What is the Fisher’s price index for A for year X when year Y is the base?
Seçenekler
A
102.0
B
25.5
C
400.0
D
240.0
E
170.5
Açıklama:
Fisher's index = (Laspeyres' index . Paashe's index)1/2 ; for this case : Laspeyres' index . Paashe's index = Fisher's index ; x = ((34 . 3) / (80 . 5)) . 100 = (102 / 400) . 100 = 25.5
Soru 20
Total price and quantity for products group A is 40 and 8, and 60 and 7, as unit a and unit b, for years X and Y, respectively. What is the Fisher’s price index for A for year Y when year X is the base ?
Seçenekler
A
74
B
80
C
1400 / 3
D
1500 / 7
E
1600 / 21
Açıklama:
Fisher's index = (Laspeyres' index . Paashe's index)1/2 ; for this case : Laspeyres' inden . Paashe's index = Fisher's index ; x = ((40 . 8) / (60 . 7)) . 100 = (320 / 420) . 100 = 1600 / 21
Soru 21
Which of the followings are true definitions about index number?
- It measures the relative change
- It considers the periods
- It is a statistical value
- It considers a reference value
- It can not transformed an equation
Seçenekler
A
I-II-III
B
I-II-IV
C
II-III-V
D
I-II-III-IV
E
I-II-III-IV-V
Açıklama:
An index number measures the relative change in price, quantity, value, or some other characteristics of interest compared to a base period. It is a statistical value that measures the change in a variable with respect to the reference value of a variable for a specific period specific period such as a starting year, a specific factory or a specific location. A simple index number can be calculated using the following equation:
Indexnumber = (value/reference value) ×100
The answer is D.
Indexnumber = (value/reference value) ×100
The answer is D.
Soru 22
For profit situations of some firms compared to firm E, the index numbers are followings;
- Firm A - 25
- Firm B - 55
- Firm C - 130
- Firm D - 100
Seçenekler
A
C-D-B-A
B
A-B-D-C
C
D-C-B-A
D
A-B-C-D
E
C-D-A-B
Açıklama:
Since the base is chosen as Firm E, the index value of Firm C is the best. The the ranking is Firm D, Firm B and Firm A. The answer is A.
Soru 23
Which of the followings shows the true definition about the fixed base simple index?
Seçenekler
A
Ratio of the value in the current period and value in the fixed base period
B
Ratio of the value in the fixed base period and value in the current period
C
Ratio of the value in the fixed base period and value in the period of interest
D
Ratio of the value in the indexed number and value in the current period
E
Ratio of the value in the future period and value in the fixed base period
Açıklama:
When you have a fixed period for the calculation of simple index values, all the index values are the division of their current observation values to the base period values of the variable that the index is calculated.
Fixed Base Simple Index = (value in the current period / value in the fixed base period ) * 100
Fixed Base Simple Index = (value in the current period / value in the fixed base period ) * 100
Soru 24
Which of the followings presents the importance of the chain based simple index?
Seçenekler
A
It calculates the chain ranking
B
It permits a comparison between two consecutive periods
C
It considers the start point in each period
D
It considers the fixed chain value
E
It calculates the ratio of the price in the current period
Açıklama:
It is possible that from time to time it is necessary to change the base for an index since many changes may occur as the time goes by. Also, sometimes one might consider the changes between consecutive periods, such as from year to year and week to week. A chain index is an index number where the value of any given period is relative to the value of the preceding period. Remember that in the fixed-base index, the index value of each period in a time series is directly related to the value of a fixed base period. In calculation of a chain-based index, the base period changes from year to year and this permits a comparison between two consecutive periods. The answer is B.
Soru 25
The price informations for different products regards to the different years are followings:
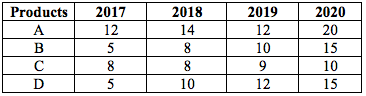 According to these information, what is the value of the simple aggregate price index for 2020 by using 2017 as the base period?
According to these information, what is the value of the simple aggregate price index for 2020 by using 2017 as the base period?Seçenekler
A
0,5
B
2
C
50
D
100
E
200
Açıklama:
The aggregate price for the year of 2017= 12+5+8+5=30
The aggregate price for the year of 2020= 20+15+10+15=60
(60/30)*100= 200
The answer is E.
The aggregate price for the year of 2020= 20+15+10+15=60
(60/30)*100= 200
The answer is E.
Soru 26
The price informations for different products regards to the different years are followings:
According to these information, what is the simple average price index for 2020 by using 2017 as the base period?
According to these information, what is the simple average price index for 2020 by using 2017 as the base period?Seçenekler
A
0,5
B
0,2
C
2,5
D
1,2
E
2,22
Açıklama:
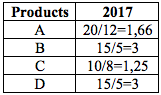 1,66 + 3 + 1,25 + 3 =8,91
8,91 / 4 = 2,22
The answer is E.
Soru 27
The following table show the prices and quantities of 4 products. According to the value of the Laspeyres Price index for 2020 using 2015 as the base period, which of the followings shows the correct definition about the price of the product group from 2015 to 2020?
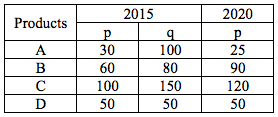
Seçenekler
A
Decreased by %9.31
B
Increased by %9.31
C
Increased by %19.36
D
Decreased by %19.36
E
Increased by %11.31
Açıklama:
Lp=(((25*100)+(90*80)+(120*150)+(50*50)) / ((30*100)+(60*80)+(100*150)+(50*50))) * 100
= (30200/25300) * 100
=1,1936 * 100
= 119,36
The answer is C.
= (30200/25300) * 100
=1,1936 * 100
= 119,36
The answer is C.
Soru 28
The following table show the prices and quantities of 4 products. According to the value of the Paasche Price index for 2020 using 2015 as the base period, which of the followings shows the correct definition about the price of the product group from 2015 to 2020?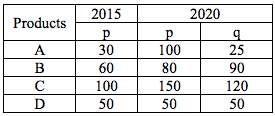
Seçenekler
A
Increased by 46.2%
B
Increased by 24.2%
C
Increased by 66%
D
Decreased by 10%
E
Same
Açıklama:
Pp=(((25*30)+(90*60)+(120*100)+(50*50)) / ((25*100)+(90*80)+(120*150)+(50*50))) * 100
= (30200/20650) * 100
=1,4624 * 100
= 146,24
The answer is A.
= (30200/20650) * 100
=1,4624 * 100
= 146,24
The answer is A.
Soru 29
What is the geometric mean of the Paasche and Laspeyres indexes?
Seçenekler
A
Geometric index
B
Multiplied index
C
Fisher's index
D
Quantitiy index
E
Price index
Açıklama:
There are advantages and disadvantages of both Paasche and Laspeyres indexes. In order to compensate, another index was created based on these two indexes. It is called Fisher’s ideal index. It is actually the geometric mean of these two indexes.
The answer is C.
The answer is C.
Soru 30
If in an index calculation, the quantities of the current period and the prices for both of the current and the base periods are used, which of the followings define this index?
Seçenekler
A
Laspeyres price index
B
Paasche's price index
C
Fisher's price index
D
Fisher's quantity index
E
Paasche's quanitity index
Açıklama:
The Paasche uses the quantities from the current period rather than a base period therefore it may be said that it reflects the buying habits of today’s customers. Overall, it measures the change in the price of commodities, in terms of quantities related to the current period. The answer is C.
Soru 31
An ______________ measures the relative change in price, quantity, value, or some other characteristics of interest compared to a base period?
Seçenekler
A
Average
B
Mode
C
Index number
D
Standard deviation
E
ANOVA
Açıklama:
An index number measures the relative change in price, quantity, value, or some other characteristics of interest compared to a base period
Soru 32
In an index, base value is 50 and today's value is 200, what is the simple index number for today's value?
Seçenekler
A
300
B
400
C
500
D
600
E
700
Açıklama:
Index number = (200 / 50) * 100=400
Soru 33
The following table shows the simple index numbers for a variable. What is the value of the base period.
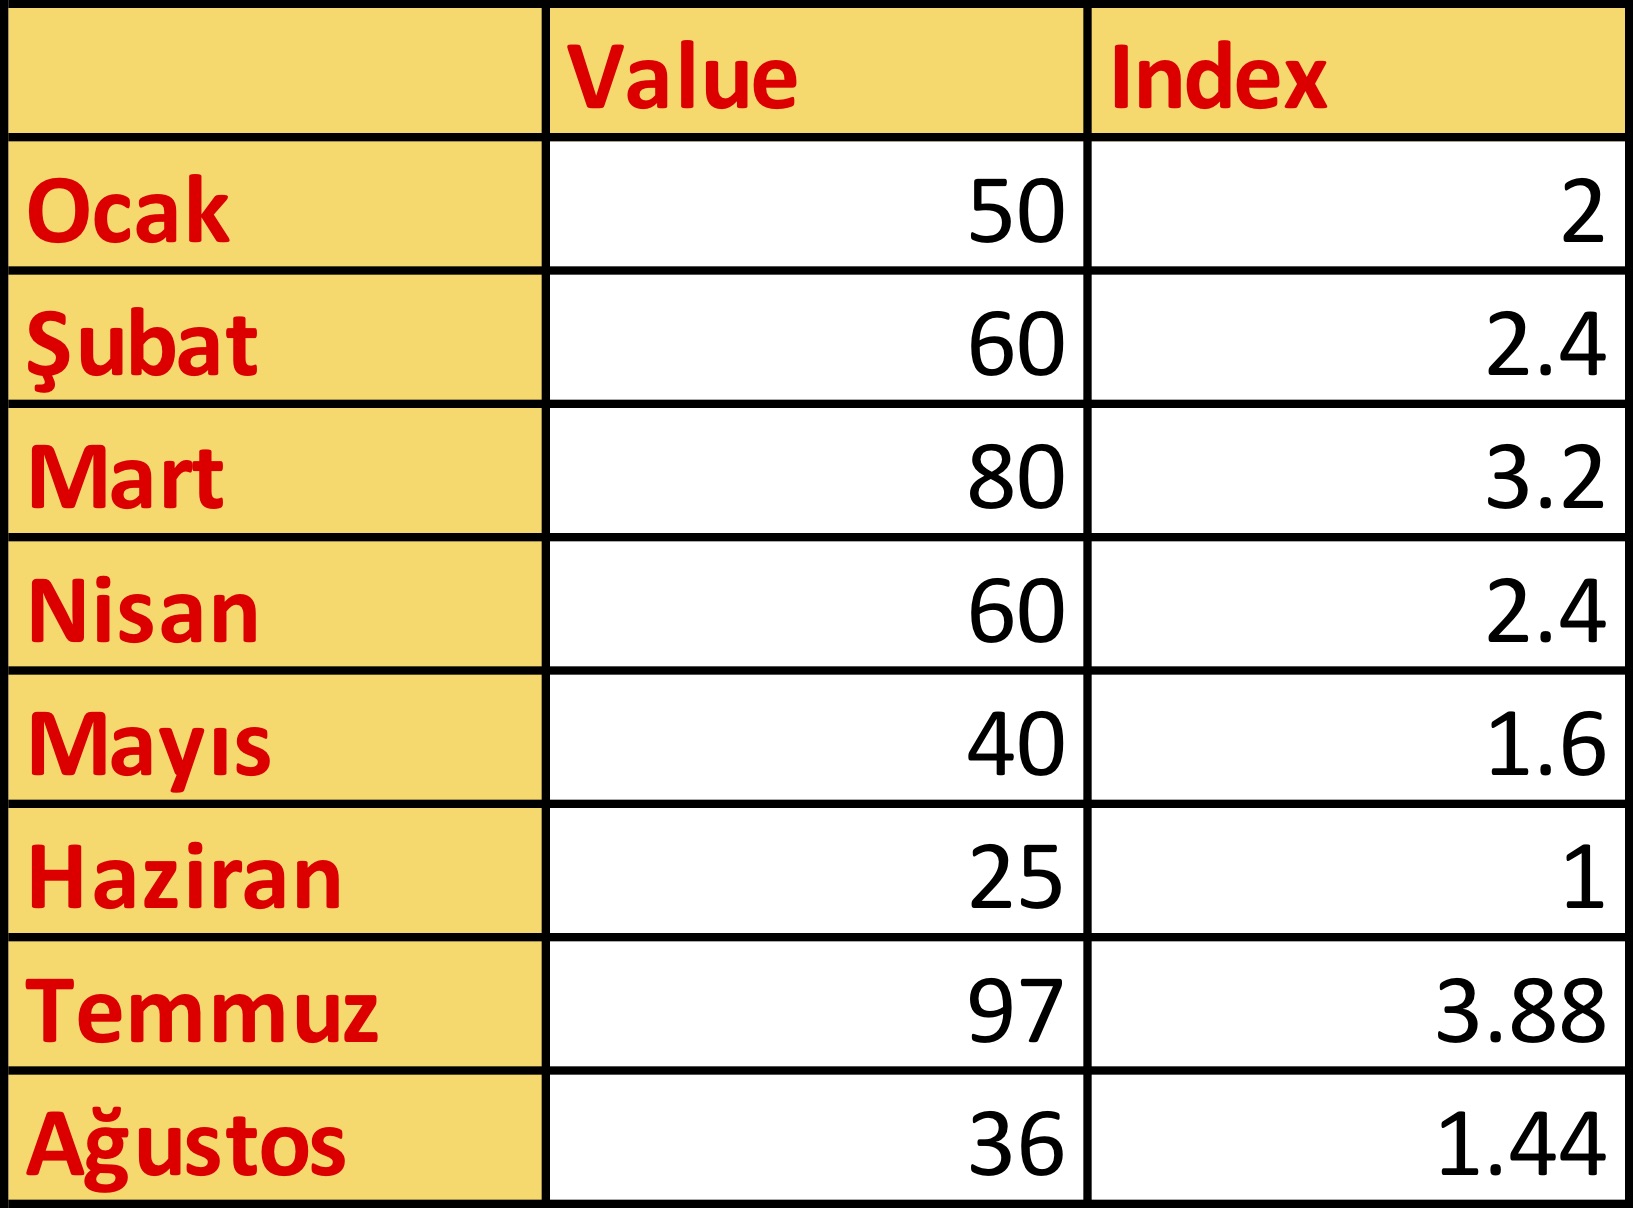
Seçenekler
A
40
B
97
C
36
D
50
E
25
Açıklama:
The base period will give an index number of 1 and it is obtained for 25.
Soru 34
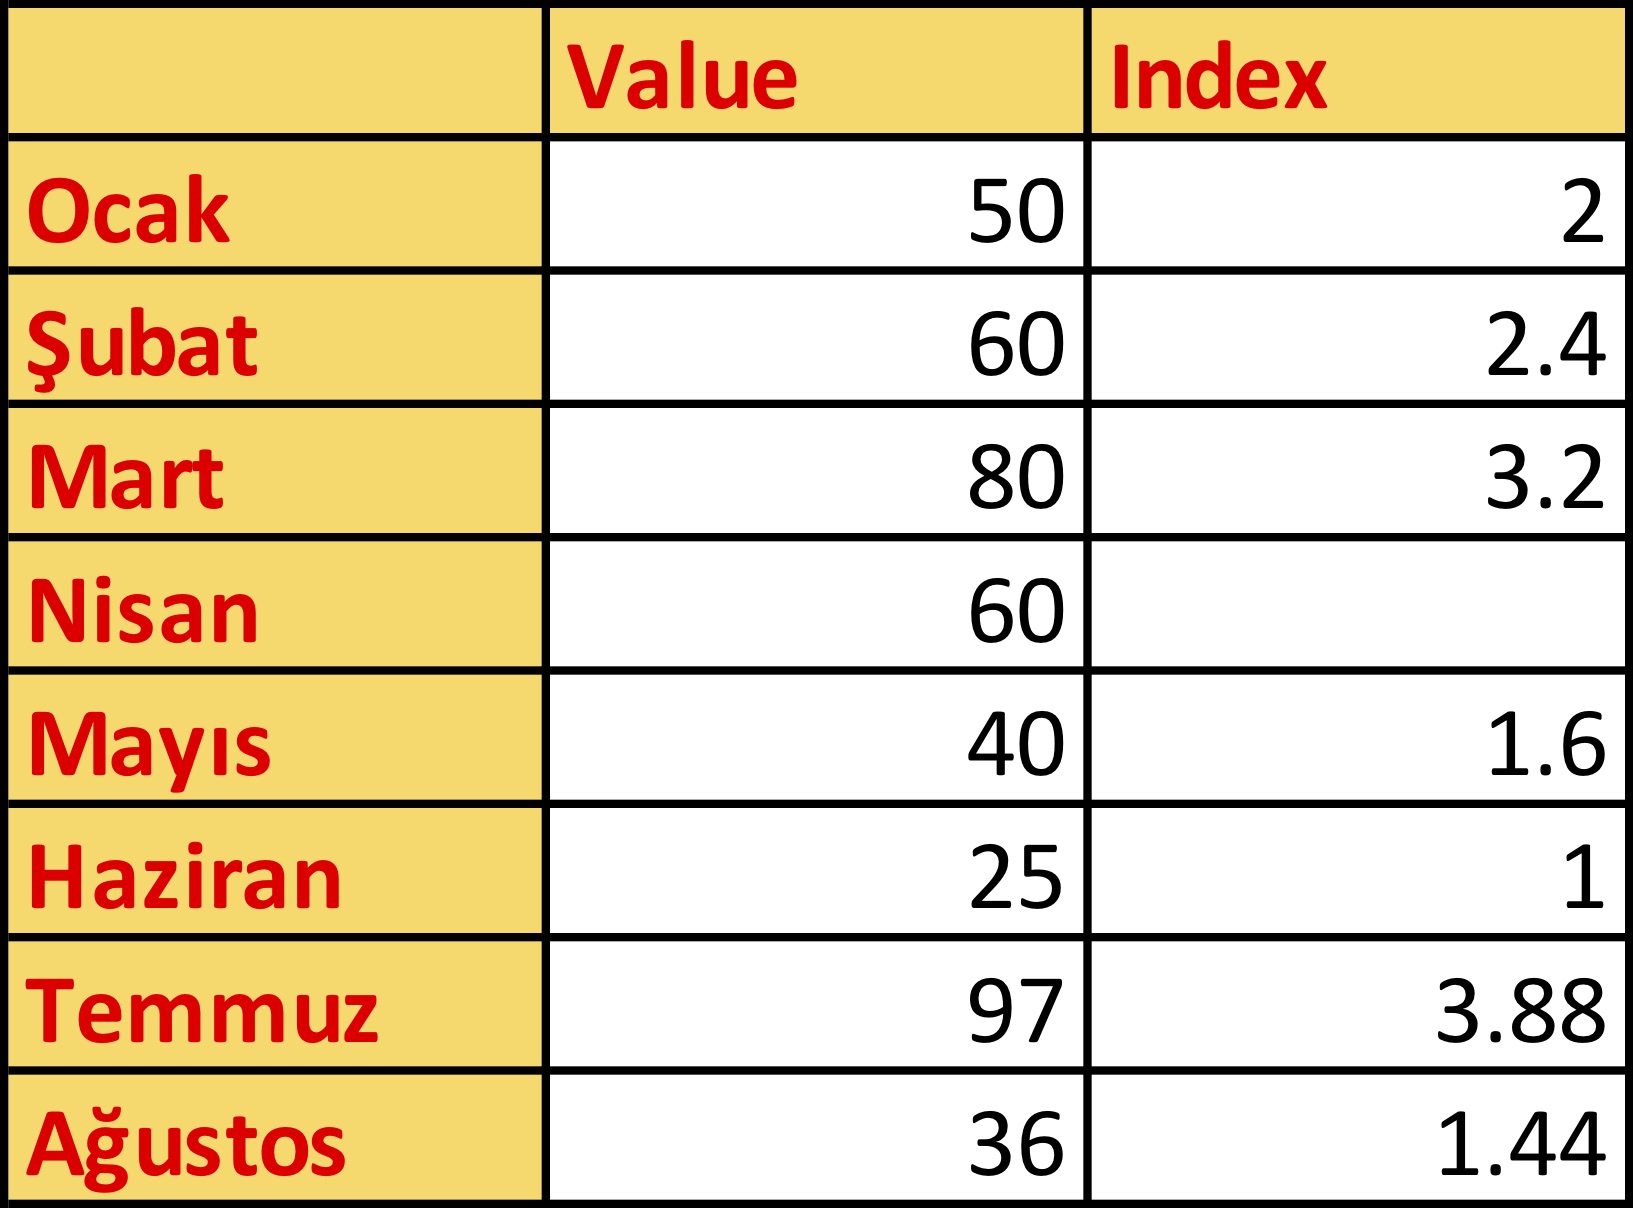 What is the simple index number for Nisan?
Seçenekler
A
2.80
B
2.40
C
1.89
D
3.45
E
9.6
Açıklama:
simple index number without 100 multiplication
60/25 =2.40
60/25 =2.40
Soru 35
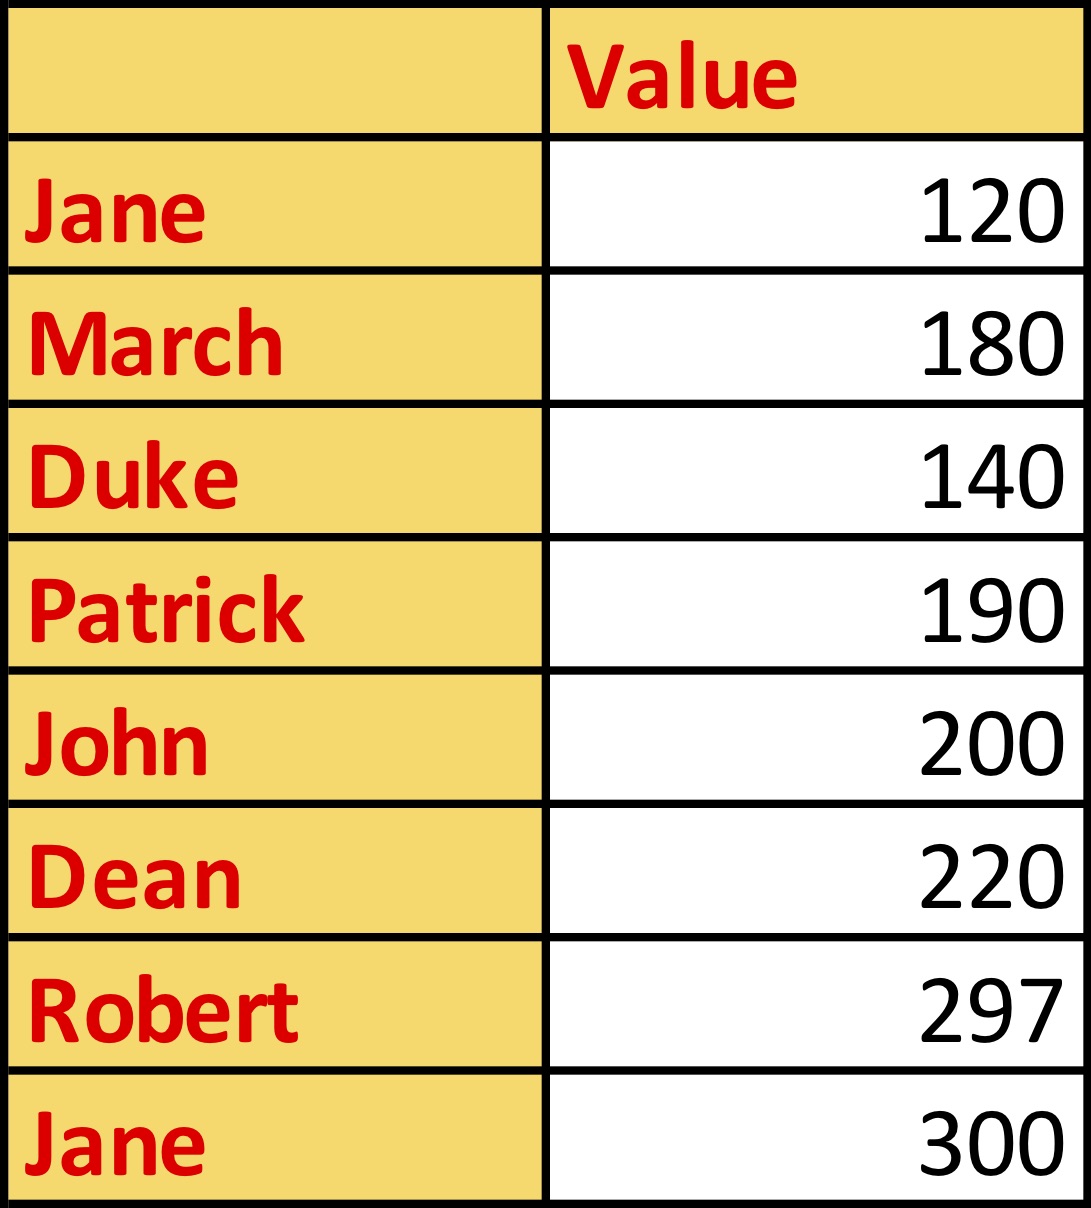
What are the simple index numbers for this data set (Jane is base period)?
Seçenekler
A
| 130.00 |
| 150.00 |
| 116.67 |
| 148.33 |
| 166.67 |
| 163.33 |
B
| 100.00 |
| 120.00 |
| 156.67 |
| 158.33 |
| 186.67 |
| 183.33 |
C
| 100.00 |
| 150.00 |
| 216.67 |
| 238.33 |
| 446.67 |
| 233.33 |
D
| 160.00 |
| 350.00 |
| 116.67 |
| 758.33 |
| 466.67 |
| 185.33 |
E
| 100.00 |
| 150.00 |
| 116.67 |
| 158.33 |
| 166.67 |
| 183.33 |
Açıklama:
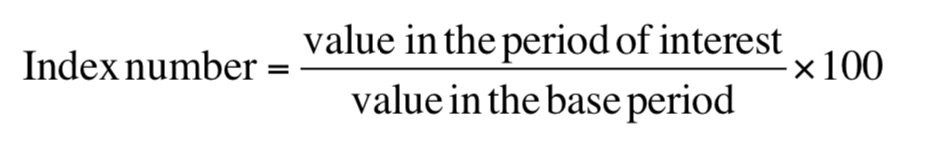
Using the formula
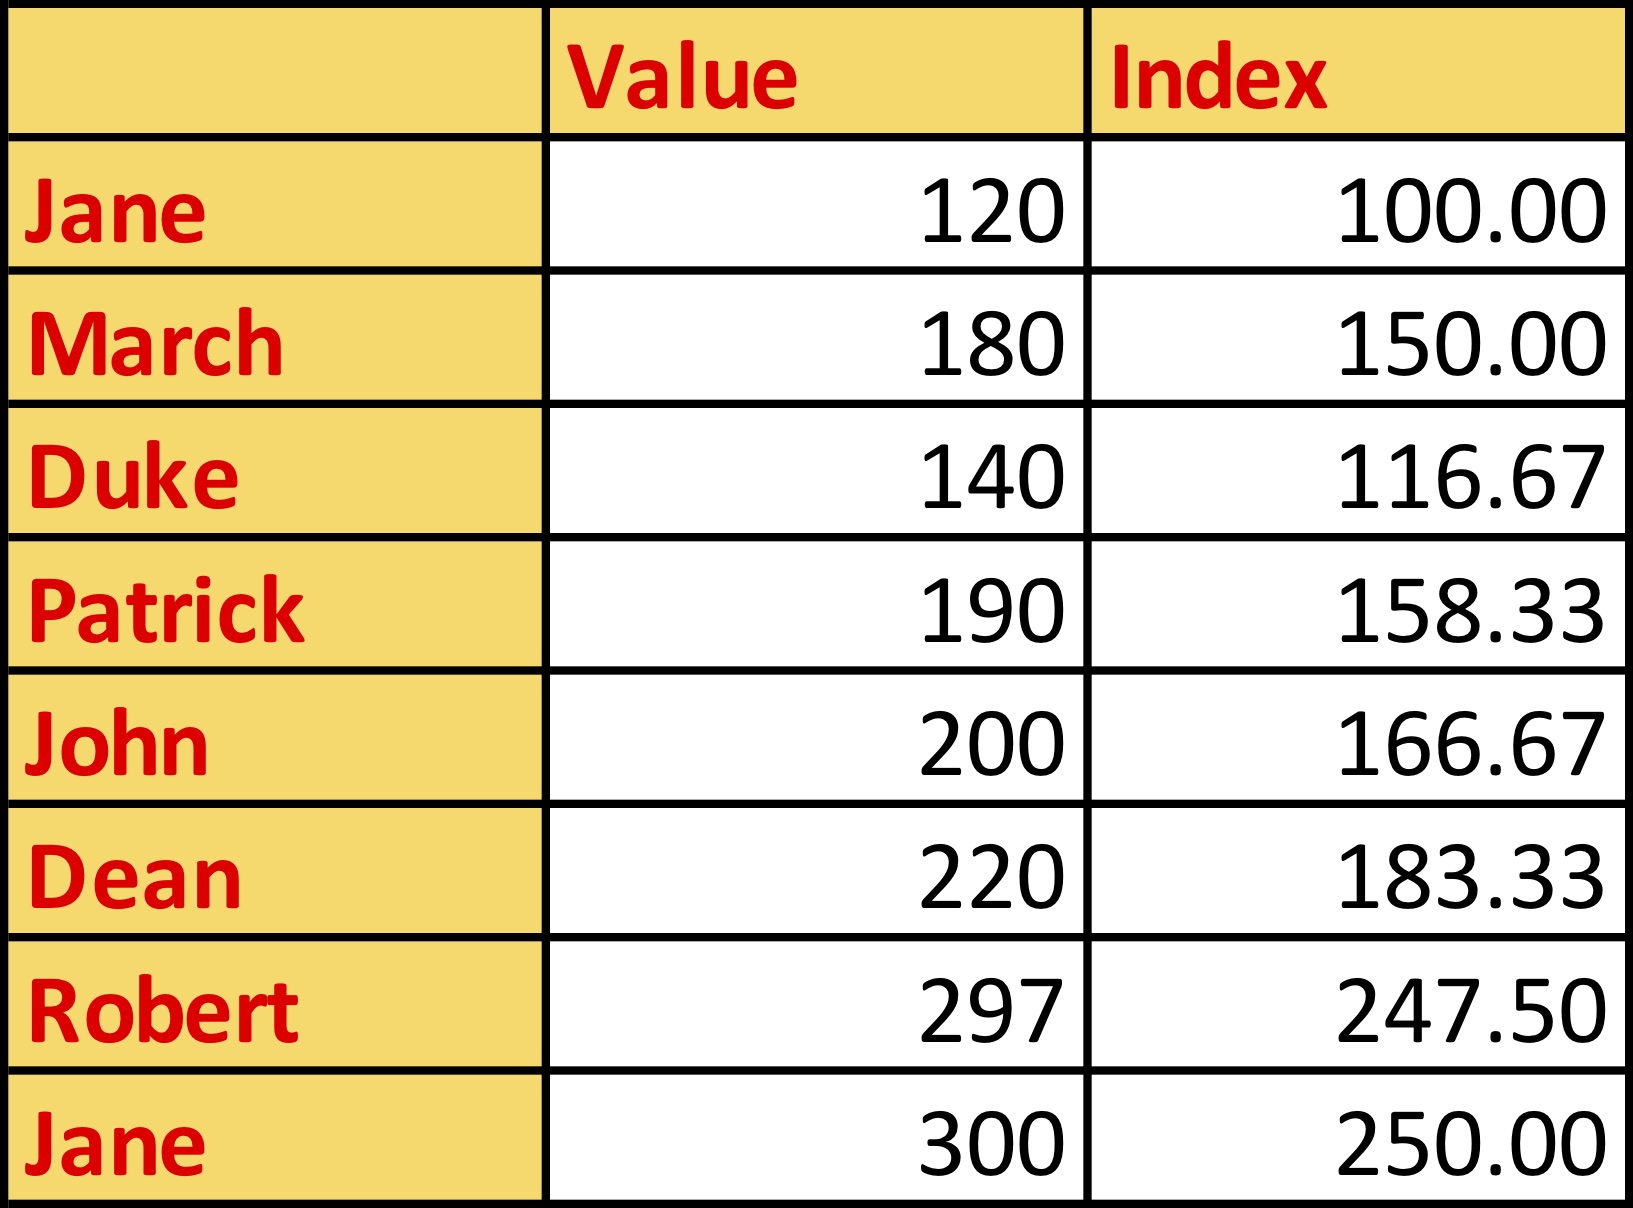
Soru 36
The price of a product in the base period is 150 TL and the price of the same product in the current period is 200, what is the simple index for price in the current period?
Seçenekler
A
180.65
B
180.54
C
150.25
D
125.50
E
133.33
Açıklama:
P(n/0)=(200/150)*100
Soru 37
If the quantity in the base period is 120 and the quantity in the current period is 100, what is the value of the simple index for quantity for current period?
Seçenekler
A
83.33
B
75.25
C
85.1
D
98.23
E
90
Açıklama:
(100 /120)*100 = 83.33
Soru 38
What is the chain-based simple index for Dean according to table?
Seçenekler
A
150
B
80
C
110
D
90
E
100
Açıklama:
CBSI=(current/preceding)*100=(220/200)*100=110
Soru 39
What is the chain-based simple index for Duke according to table?Seçenekler
A
15.8
B
112.87
C
120.78
D
82.45
E
77.78
Açıklama:
CBIP=(current/preceding)*100=(140/180)*100=77.78
Soru 40
A ________________ index number is constructed to show the changes when there are a number of different items collected together?
Seçenekler
A
simple
B
composite
C
aggregate
D
average
E
quantity
Açıklama:
A composite index number is constructed to show the changes when there are a number of different items collected together.
Soru 41
Some countries and their populations are given below : Austria:8.751.820 France:65.233.271 Italy: 59.290.969 Spain: 46.397.452 What is the index number for France when compared to Spain?
Seçenekler
A
140.60
B
127.79
C
100.00
D
22.18
E
18.86
Açıklama:
A simple index number can be calculated using the following equation: I
Indexnumber = (value / referencevalue) ×100
In this example the value is France's population and the reference value is Spain's population.
(65.233.271 / 46.397.452) ×100 = 140.60
Indexnumber = (value / referencevalue) ×100
In this example the value is France's population and the reference value is Spain's population.
(65.233.271 / 46.397.452) ×100 = 140.60
Soru 42
The manager of a company has looked at the monthly average sales of a product for the last ten years and created the table below :
 Choosing January as a base; what is the the simple index number for April?
Choosing January as a base; what is the the simple index number for April?Seçenekler
A
100
B
121.71
C
118.42
D
263.11
E
198.23
Açıklama:
Fixed Base Simple Index = (value in the current period / value in the fixed baseperiod) ×100
April Fixed Base Simple Index = (180 / 152) x 100 =118.42
April Fixed Base Simple Index = (180 / 152) x 100 =118.42
Soru 43
Which index indicates the change in the price of a single item between two consecutive periods?
Seçenekler
A
Fixed-Based Simple Index
B
Chain-Based Simple Index
C
Simple Index for Quantity
D
Simple Index for Price
E
Index Number
Açıklama:
Chain-based simple price index indicates the change in the price of a single item between two consecutive periods. It is calculated by dividing the price of a product in the current period by the price of the same product in the preceding period and the result is expressed as percentage. The correct answer is B.
Soru 44
Which index is known as the average of weighted relative prices since it is a composite index number of prices formed by the weighted sum method?
Seçenekler
A
Fisher’s Ideal Index
B
Paasche's Index
C
Laspeyres’ Index
D
Consumer Price Index
E
Chain-Based Simple Index
Açıklama:
Laspeyres Index was created by the German economist Étienne Laspeyres. The technique designed by Laspeyres uses base-period weights. It consists of the information about the price and quantity of products in different periods. The weighting scheme makes it a better tool than simple indexes. By using the Laspeyres index, it is possible to make a comparison of today’s price and quantity between the price and quantity of items altogether for a base period. The Laspeyres price index is also known as the average of weighted relative prices since it is a composite index number of prices formed by the weighted sum method. The index is found by the ratio of the sum of prices in the current period to the sum of the prices in the base period, these sums are weighted by the respective quantities of the base period. In this case, the weights which are used are the quantities of each commodity in the base period. So, it measures the relative price change of the commodities when the respective quantities are considered unchanged. The correct answer is B.
Soru 45
_______is a family of indexes that measures the average change over time in selling prices received by domestic producers of goods and services.
Which of the following completes the definition best?
Which of the following completes the definition best?
Seçenekler
A
Consumer Price Index
B
Producer Price Index
C
Weighted Composite Indexes
D
Simple Aggregate Index
E
Chain-Based Index for Quantity
Açıklama:
The producer price index (PPI) is a family of indexes that measures the average change over time in selling prices received by domestic producers of goods and services. It is an output index and designed for domestic goods’ price changes; imports are not included. This index is based on the first commercial transaction of each product in non-retail markets. The correct answer is B.
Soru 46
What is constructed from changes in a number of different items and reflects the average change in the actvity of a group of items from the base period to the period under consideration?
Seçenekler
A
Composite index number
B
Weighted index number
C
Index value
D
Index number
E
Chain-based index number
Açıklama:
A composite index number is constructed from changes in a number of different items and reflects the average change in the actvity of a group of items from the base period to the period under consideration.The correct answer is A.
Soru 47
When are the weighted index numbers used?
Seçenekler
A
When all commodities are of equal importance
B
When all commodities are not of equal importance
C
When the commodities are not certain
D
When the commodities are certain
E
When the commodities are equal for a year
Açıklama:
When all commodities are not of equal importance in the composite index calculations, weighted index numbers are used by assigning weight to each commodity relative to its importance. The correct answer is B.
Soru 48
When the Laspeyres quantity index is calculated, the price is the weight in the ____ period.
Which of the following completes the sentence best?
Which of the following completes the sentence best?
Seçenekler
A
next
B
current
C
base
D
every
E
previous
Açıklama:
The Laspeyres price index is calculated by the ratio of the sum of prices in the current period to the sum of the prices in the base period, these sums are weighted by the respective quantities of the base period. In this case, the weights which are used are the quantities of each commodity in the base period. When the Laspeyres quantity index is calculated, the price is the weight in the base period. In the calculation of the Paasche price index, the current period quantities are used as weights, so it is also known as the current year weighted index. When the Paasche Quantity Index is constructed, the price is the weight in the current period. The correct answer is C.
Soru 49
What measures the relative change in price, quantity, value, or some other characteristics of interest compared to a base period?
Seçenekler
A
Value
B
Reference value
C
Index number
D
Price Index
E
Quantity Index
Açıklama:
An index number measures the relative change in price, quantity, value, or some other characteristics of interest compared to a base period. It is a statistical value that measures the change in a variable with respect to the reference value of a variable for a specific period specific period such as a starting year, a specific factory or a specific location. The correct answer is C.
Soru 50
Which of the following is an example of a basic index number?
Seçenekler
A
-1
B
120.3
C
50 / 432
D
60%
E
x
Açıklama:
Depending on the number of variables included in the comparison, index numbers can be different. If an index number is used to measure the relative change in just one variable, this indicates a simple index. In the simple index calculation, the ratio of the two variables is converted to a percentage. In other words, index numbers are the percentage of a comparison with a reference value written without the percent symbol. It is important to determine what to write in the reference value field since the simple index calculations can be examined as a fixed based method and chain-based method. In applications, two types of indexes dominate, which are price and quantity indexes. The correct answer is B.
Ünite 7
Soru 1
In a binomial test, if the P is 0.40, what is the value of Q?
Seçenekler
A
0.50
B
0.30
C
0.20
D
0.60
E
0.80
Açıklama:
Q=1-P
Q=1-0.40
Q=0.60
Q=1-0.40
Q=0.60
Soru 2
In a binomial test, if the Q is 0.30, what is the value of P?
Seçenekler
A
0.20
B
0.30
C
0.50
D
0.70
E
0.90
Açıklama:
P = 1 - Q
P = 1 - 0.70
P = 0.70
P = 1 - 0.70
P = 0.70
Soru 3
In a binomial test, the investigaor is interested in the proportion of boys in a school. In the sample of 250 students, there are 175 boys. What is the value of P for a binomial test for boys?
Seçenekler
A
0.40
B
0.50
C
0.60
D
0.70
E
0.80
Açıklama:
P = 175 / 250 = 0.70
Soru 4
In a binomial test problem, n = 6 and x = 2, what is the value of  in this problem?
Seçenekler
A
10
B
12
C
15
D
24
E
36
Açıklama:
Soru 5
In a binomial test, what is the sample size to decide whether the sample size is small or large?
Seçenekler
A
10
B
25
C
30
D
40
E
55
Açıklama:
If the sample size is n ≤ 25, we accept the sample size is small, otherwise the sample size is accepted as large.
Soru 6
In a binomial test, x =35, n= 60 and P=0.55, what is the observed/calculated z value?
Seçenekler
A
0.154
B
0.389
C
0.657
D
0.796
E
0.872
Açıklama:
since 35 > 60 * 0.55
z = [(35-0.5)-33]/[sqrt(60*0.55*0.45)]= 1.5 / 3.854 = 0.389
z = [(35-0.5)-33]/[sqrt(60*0.55*0.45)]= 1.5 / 3.854 = 0.389
Soru 7
What is the name of the nonparametric test that is used for the hypothesis test about the population median?
Seçenekler
A
The sign test
B
z test
C
t test
D
MANOVA
E
F test
Açıklama:
The sign test gets its name from the negative and positive signs of the mathematical difference of the observations’ measurements. It is used for the hypothesis test about the population median, M.
Soru 8
In a sign test the median is 12 and here are the observations in the sample: 5, 6, 8, 9, 14, 15, 16, 18, 20, 24. What is the n+ value for the sign test?
Seçenekler
A
2
B
4
C
6
D
8
E
10
Açıklama:
It is the number of positive signs for (x-Median) differences therefore the answer is 6.
Soru 9
In a sign test the median is 17 and here are the observations in the sample: 5, 6, 3, 6, 9, 7, 8, 9, 6, 15, 18, 19, 20, 24 What is the n- value for the sign test?
Seçenekler
A
4
B
6
C
8
D
10
E
12
Açıklama:
It is the number of negative signs (x-Median) differences therefore the answer is 10
Soru 10
_______________ tests are used to determine whether a data set comes from a particular distribution
Seçenekler
A
t
B
z
C
Sign
D
Goodness of fit
E
Wilcoxon Rank Sum
Açıklama:
Goodness of fit tests are used to determine whether a data set comes from a particular distribution.
Soru 11
Which one of the following statements is true?
Seçenekler
A
Parametric tests are used when certain assumptions are not met.
B
The validity of the assumptions are important for nonparametric tests.
C
Parametric tests require at least ratio scaled measurements.
D
Assumptions used in non-parametric tests are fewer and weaker than those in parametric tests.
E
There is no assumption for non-parametric tests.
Açıklama:
Review the Introduction part, p. 159
Soru 12
Which one of the following non-parametric tests is used for two sample problems?
Seçenekler
A
Binomial Test
B
The Sign Test
C
Wilcoxon Rank Sum Test
D
The Chi-Square Goodness of Fit Test
E
The Kolmogorov-Smirnov Test
Açıklama:
Review the part NON-PARAMETRIC STATISTICS FOR ONE-SAMPLE PROBLEM
Except for Wilcoxon Rank Sum Test, tests at the other alternatives are used for one sample cases.
Except for Wilcoxon Rank Sum Test, tests at the other alternatives are used for one sample cases.
Soru 13
Which one of the following is used for the hypothesis test about the population median?
Seçenekler
A
Kruskal-Wallis Test
B
Wilcoxon Rank Sum Test
C
The Chi-Square Goodness of Fit Test
D
The Sign Test
E
The Binomial Test
Açıklama:
Review the 'The Sign Test' part
The sign test gets its name from the negative and positive signs of the mathematical difference of the observations’ measurements. It is used for the hypothesis test about the population median, M.
The sign test gets its name from the negative and positive signs of the mathematical difference of the observations’ measurements. It is used for the hypothesis test about the population median, M.
Soru 14
I. It determines whether the scores in the sample come from a population with
theoretical distribution.
II. It is one of the goodness of fit tests.
III. The level of measurement for data is at least interval.
Which one/s of the statements given above is correct about Kolmogorov Smirnov Test?
theoretical distribution.
II. It is one of the goodness of fit tests.
III. The level of measurement for data is at least interval.
Which one/s of the statements given above is correct about Kolmogorov Smirnov Test?
Seçenekler
A
Only I
B
I and II
C
I and III
D
II and III
E
I, II and III
Açıklama:
Review the part 'Kolmogorov Smirnov Test'
The level of measurement for data is at least ordinal in Kolmogorov Smirnov test.
The level of measurement for data is at least ordinal in Kolmogorov Smirnov test.
Soru 15
Answer the following three questions (Q5,Q6 and Q7) according to those information.
The following table contains the exam scores of three different classes.
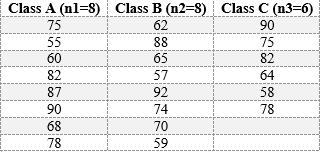 A mathematics teacher wants to test whether the distribution of exam scores for all classes are identical or not. Which test should be used for that hypothesis testing? (Confidence level= 0.95)
The following table contains the exam scores of three different classes.
A mathematics teacher wants to test whether the distribution of exam scores for all classes are identical or not. Which test should be used for that hypothesis testing? (Confidence level= 0.95)Seçenekler
A
Kruskal-Wallis Test
B
The Sign Test
C
Spearman’s Rank Correlation Coefficient
D
The Chi-Square Goodness of Fit Test
E
Kolmogorov Smirnov Test
Açıklama:
Review the 'Kruskal Wallis' part at page 178.
There are more than two independent groups in that question. That is why Kruskal Wallis Test should be used.
There are more than two independent groups in that question. That is why Kruskal Wallis Test should be used.
Soru 16
What is the value of test statistic H calculated in that hypothesis testing?
Seçenekler
A
0,424
B
0,482
C
0,500
D
0,625
E
0,846
Açıklama:
Review the Kruskal Wallis Test at page 178.
Use the H formula at page 178.
H= 0.424
Use the H formula at page 178.
H= 0.424
Soru 17
What is the decision reached as a result of hypothesis testing process?
Seçenekler
A
Ho is rejected since critical value is greater than the H statistic.
B
Ho is rejected since critical value is less than the H statistic.
C
The critical value and H statistic is equal to each other.
D
Ho is accepted since critical value is less than the H statistic.
E
Ho is accepted since critical value is greater than the H statistic.
Açıklama:
Review the 'Kruskal Wallis Test'
The critical value is 5.991. The calculated H statistic was 0.424 from the previous question. Since critical value is greater than H statistic, Ho accepted and it is concluded that the exam scores distributions for all departments are identical.
The critical value is 5.991. The calculated H statistic was 0.424 from the previous question. Since critical value is greater than H statistic, Ho accepted and it is concluded that the exam scores distributions for all departments are identical.
Soru 18
I. It is suitable to use when one of the two variables in the question is measured in ordinal scale.
II. Spearman’s Rank Correlation Coefficient is a nonparametric alternative to Pearson.
III. It can be used when association between the variables is not linear.
Which of the statement/s above is correct about Pearson correlation coefficient?
II. Spearman’s Rank Correlation Coefficient is a nonparametric alternative to Pearson.
III. It can be used when association between the variables is not linear.
Which of the statement/s above is correct about Pearson correlation coefficient?
Seçenekler
A
Only I
B
I and II
C
Only II
D
II and III
E
I, II and III
Açıklama:
Review 'Spearman’s Rank Correlation Coefficient' part.
Pearson’s coefficient of correlation is not suitable if one of the two variables in the
question is measured in ordinal scale or the association between the variables is not linear.
Pearson’s coefficient of correlation is not suitable if one of the two variables in the
question is measured in ordinal scale or the association between the variables is not linear.
Soru 19
Which one of the following values cannot be calculated for Spearman's rank correlation coefficient?
Seçenekler
A
-0.659
B
-0.325
C
0.480
D
0.932
E
1.25
Açıklama:
Review the 'Spearman Rank Correlation Coefficient' part.
Spearman’s rank correlation coefficient takes the values between -1 and +1.
Spearman’s rank correlation coefficient takes the values between -1 and +1.
Soru 20
Ho :The distribution of differences is symmetrical around MD= 0
Which of the following tests is related to the given null hypothesis?
Which of the following tests is related to the given null hypothesis?
Seçenekler
A
Wilcoxon Signed Rank Test
B
Kruskal Wallis Test
C
Binomial Test
D
The Kolmogorov-Smirnov Test
E
Spearman’s Rank Correlation Coefficient
Açıklama:
Review the page 175.
Soru 21
Which of the following is the correct alternative hypothesis for binomial test?
Seçenekler
A
H1: P ≤ Q
B
H1: P ~ Q
C
H1: P = Q
D
H0: P = Q
E
H1: P < Q
Açıklama:
Two different approaches in the binomial test can be used since the test statistics used in the binomial test change according to sample size. These approaches are called the small sample and the large sample approaches. If the sample size is n ≤ 25, we accept the sample size is small, otherwise the sample size is accepted as large In the binomial test, alternative hypotheses are constructed in three different ways. The hypotheses can be written as follows.
H1:P < Q
H1:P > Q
H1:P ≠ Q
H1:P < Q
H1:P > Q
H1:P ≠ Q
Soru 22
..................... is a measure of association for ranked data. In addition, it can be used when the relation between two variables is not linear.
Which of the following test is described above?
Which of the following test is described above?
Seçenekler
A
Spearman’s rank correlation coefficient
B
Wilcoxon rank sum test
C
The Binomial Test
D
One-Sample Test
E
Goodness of Fit Test
Açıklama:
Of all the statistical techniques involving ranks, Spearman’s rank correlation coefficient is the earliest one and today it is well known among the scientists. Spearman’s rank correlation coefficient is a measure of association for ranked data. In addition, it can be used when the relation between two variables is not linear.
Soru 23
.........................is a non-parametric alternative test for one sample t test, paired sample t test, and a researchin which quantitative measurements is impossible but in which it is possible to rank the measurements with respect to each other. It is used for the hypothesis test about the population median, M. Inferences about the population median are important when the population has highly skewed distribution. Which of the following test should be writen to the gap?
Seçenekler
A
One-Sample Test
B
Goodness of Fit Test
C
The Binomial Test
D
The Sign Test
E
Wilcoxon Rank Sum Test
Açıklama:
The sign test gets its name from the negative and positive signs of the mathematical difference of the observations’ measurements. It is used for the hypothesis test about the population median, M. Inferences about the population median are important when the population has highly skewed distribution. In skewed distributions, the population median is more centrally located than the population mean. Therefore, population median is accepted as better estimator for the measure of location if the population is skewed. The sign test is a non-parametric alternative test for one sample t test, paired sample t test, and a research in which quantitative measurements is impossible but in which it is possible to rank the measurements with respect to each other.
Soru 24
Which of the following test is the most commonly used goodness of fit test?
Seçenekler
A
The Chi-Square Test
B
The Kolmogorov-Smirnov Test
C
Wilcoxon Rank Sum Test
D
Wilcoxon Signed Rank Test
E
Kruskal-Wallis Test
Açıklama:
The functional form of a population distribution is often needed when performing statistical analyses. The functional form of the distribution may be used for confirming a theory or validating a statistical model which
is used to analyze the data. Goodness of fit tests are used to determine whether a data set comes from a particular distribution.
Some null and alternative hypotheses examples about the population distributions are given below.
is used to analyze the data. Goodness of fit tests are used to determine whether a data set comes from a particular distribution.
Some null and alternative hypotheses examples about the population distributions are given below.
- H0 : The population distribution is Normal Distribution
- H1 : The population distribution is not Normal Distribution
- H0 : The population distribution is Poisson Distributio
- H1 : The population distribution is not Poisson Distribution
Soru 25
Which of the following non-parametric tests is not used for one-sample-problem?
Seçenekler
A
Spearman’s Rank Correlation Coefficient
B
The Kolmogorov-Smirnov Test
C
The Chi-Square Goodness of Fit Test
D
The Sign Test
E
The Binomial Test
Açıklama:
Generally, there are four non-parametric tests for one sample case. These are:
- The Binomial Test
- The SignTest
- The Chi-Square Goodness of Fit Test
- The Kolmogorov-Smirnov Test
Soru 26
I. H1 : The first population is shifted to the right of the second population
II. H1 : The first population is shifted to the left of the second population
III. H1 : The first and the second populations are shifted from each other
Which of the above is the correct alternative hypothesis sentence for Wilcoxon Rank Sum Test?
II. H1 : The first population is shifted to the left of the second population
III. H1 : The first and the second populations are shifted from each other
Which of the above is the correct alternative hypothesis sentence for Wilcoxon Rank Sum Test?
Seçenekler
A
I
B
II
C
III
D
II, III
E
I, II, III
Açıklama:
The parametric independent samples t test is based on several assumptions: two samples are independent of each other, the populations in the investigation for t test are normally distributed, and two populations hat these two samples are taken from has the same variability.
In this test, the alternative hypotheses are constructed in three different ways. The hypotheses are shown as follows.
In this test, the alternative hypotheses are constructed in three different ways. The hypotheses are shown as follows.
- H0 : The two populations are identical
- H1a : The first population is shifted to the right of the second population
- H1b : The first population is shifted to the left of the second population
- H1c : The first and the second populations are shifted from each other
Soru 27
What is the value ranged of Spearman’s Rank Correlation Coefficient?
Seçenekler
A
-1,0
B
-0,1, 0
C
0, +1
D
0, +0,1
E
-1 , + 1
Açıklama:
Spearman’s rank correlation coefficient takes the values between -1 and +1. The coefficient close to +1 indicates positive association between the variables. On the other hand, negative values close to -1 denotes negativeassociation. A value near 0 means there is no association between these two variables.
Soru 28
Which of the following is non-parametric statistics for two dependent samples?
Seçenekler
A
Wilcoxon Rank Sum Test
B
Wilcoxon Signed Rank Test
C
Kruskal-Wallis Test
D
The Kolmogorov-Smirnov Test
E
Spearman Rank Correlation Coefficient
Açıklama:
When we consider that the population of differences are symmetrical, a non-parametric test, which is called Wilcoxon signed rank, test is often more powerful than the sign test for making inferences about the population median differences MD. Hence, the main assumption of the test is that the population of differences are continuous and symmetrical.
Specifically, the test under consideration is called Wilcoxon Signed Rank Test for use in a design where there are twodependent populations.
Specifically, the test under consideration is called Wilcoxon Signed Rank Test for use in a design where there are twodependent populations.
Soru 29
............ is used to decide whether k independent samples are drawn from different populations. It is an extension of the Wilcoxon sum rank test to a comparison of more than two populations. It assumes that the variable under consideration is measured on at least ordinal scale.
Which of the following test should be written the gap above.
Which of the following test should be written the gap above.
Seçenekler
A
Kruskal-Wallis Test
B
Spearman’s Rank Correlation Coefficient
C
Wilcoxon Signed Rank Test
D
The Kolmogorov-Smirnov Test
E
The Chi-Square Goodness of Fit Test
Açıklama:
The one-way analysis of variance has some assumptions such as independent samples, normality, and equal variances. When the conditions of normality and equal variances are not valid, Kruskal-Wallis is a non-parametric alternative test that involves less conditions. The Kruskal-Wallis test is used to decide whether k independent samples are drawn from different populations. It is an extension of the Wilcoxon sum rank test to a comparison of more than two populations. The Kruskal-Wallis test assumes that the variable under consideration is measured on at least ordinal scale.
Soru 30
What does the value near 0 of Spearman’s rank correlation coefficient mean?
Seçenekler
A
Negative association between the variables
B
Positive association between the variables
C
No association between these two variables.
D
Very few association between these two variables.
E
These two variables follow follow same patern.
Açıklama:
Spearman’s rank correlation coefficient takes the values between -1 and +1. The coefficient close to +1 indicates positive association between the variables. On the other hand, negative values close to -1 denotes negative association. A value near 0 means there is no association between these two variables.
Soru 31
If the assumptions of certain tests can not be satisfied what do we need to use for testing?
Seçenekler
A
ANOVA
B
Linear Regression
C
Non-Parametric statistics
D
Parametric statistics
E
Variance
Açıklama:
Parametric tests used in statistics require to specify certain conditions or assumptions to be met in order to make decisions and estimates about population parameters using sample data. The reliability of a parametric test depends heavily on the validity of the assumptions. In addition, parametric tests require at least interval scaled measurements. As you can easily imagine that restricting the data measurement level to interval scales creates a problem since the world, we live in, is not just surrounded by variables that are measured in interval scale.
A non-parametric statistical test does not specify certain conditions or assumptions to be met about population parameters using sample data. The assumptions used in non-parametric tests are that the observations in the sample are independent and the variable under study has underlying continuity. However, these assumptions are fewer and weaker than those used in parametric tests.
A non-parametric statistical test does not specify certain conditions or assumptions to be met about population parameters using sample data. The assumptions used in non-parametric tests are that the observations in the sample are independent and the variable under study has underlying continuity. However, these assumptions are fewer and weaker than those used in parametric tests.
Soru 32
When a probability of obtaining an outcome, out of two outcomes, on one trial is known and a probability of the number of times the same outcome might appear, say x times out of n independent trials is tried to be found, which probability distribution is used?
Seçenekler
A
Normal
B
t
C
z
D
F
E
Binomial
Açıklama:
There is a specific distribution called binomial distribution. The Binomial distribution is used when a probability of obtaining an outcome, out of two outcomes, on one trial is known and a probability of the number of times the same outcome might appear, say x times out of n independent trials is tried to be found. Mainly the binomial distribution is the sampling distribution of the proportions estimated from sample data. The binomial test tells us whether it is reasonable to conclude that the proportions we obtain from our sample could have been drawn from a population with a particular value of P.
Soru 33
If the alternative hypothesis is written as H1:P < Q in small sample Binomial test, how do we find the p-value?
Seçenekler
A 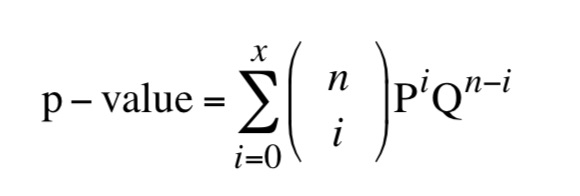
B 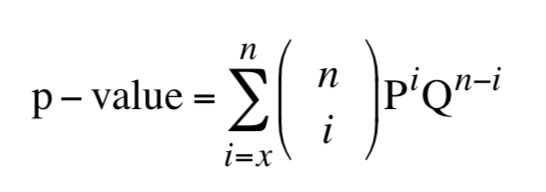
C 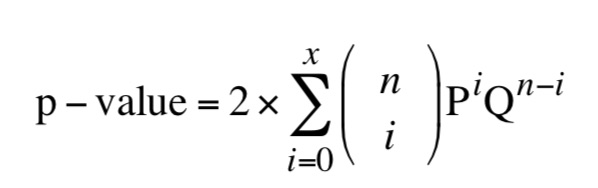
D 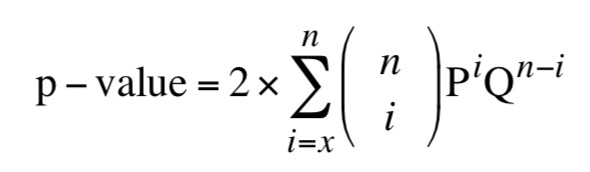
E 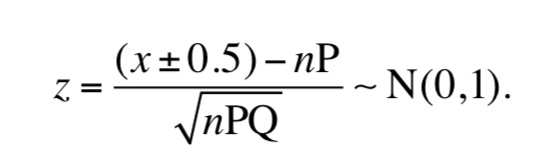
Açıklama:
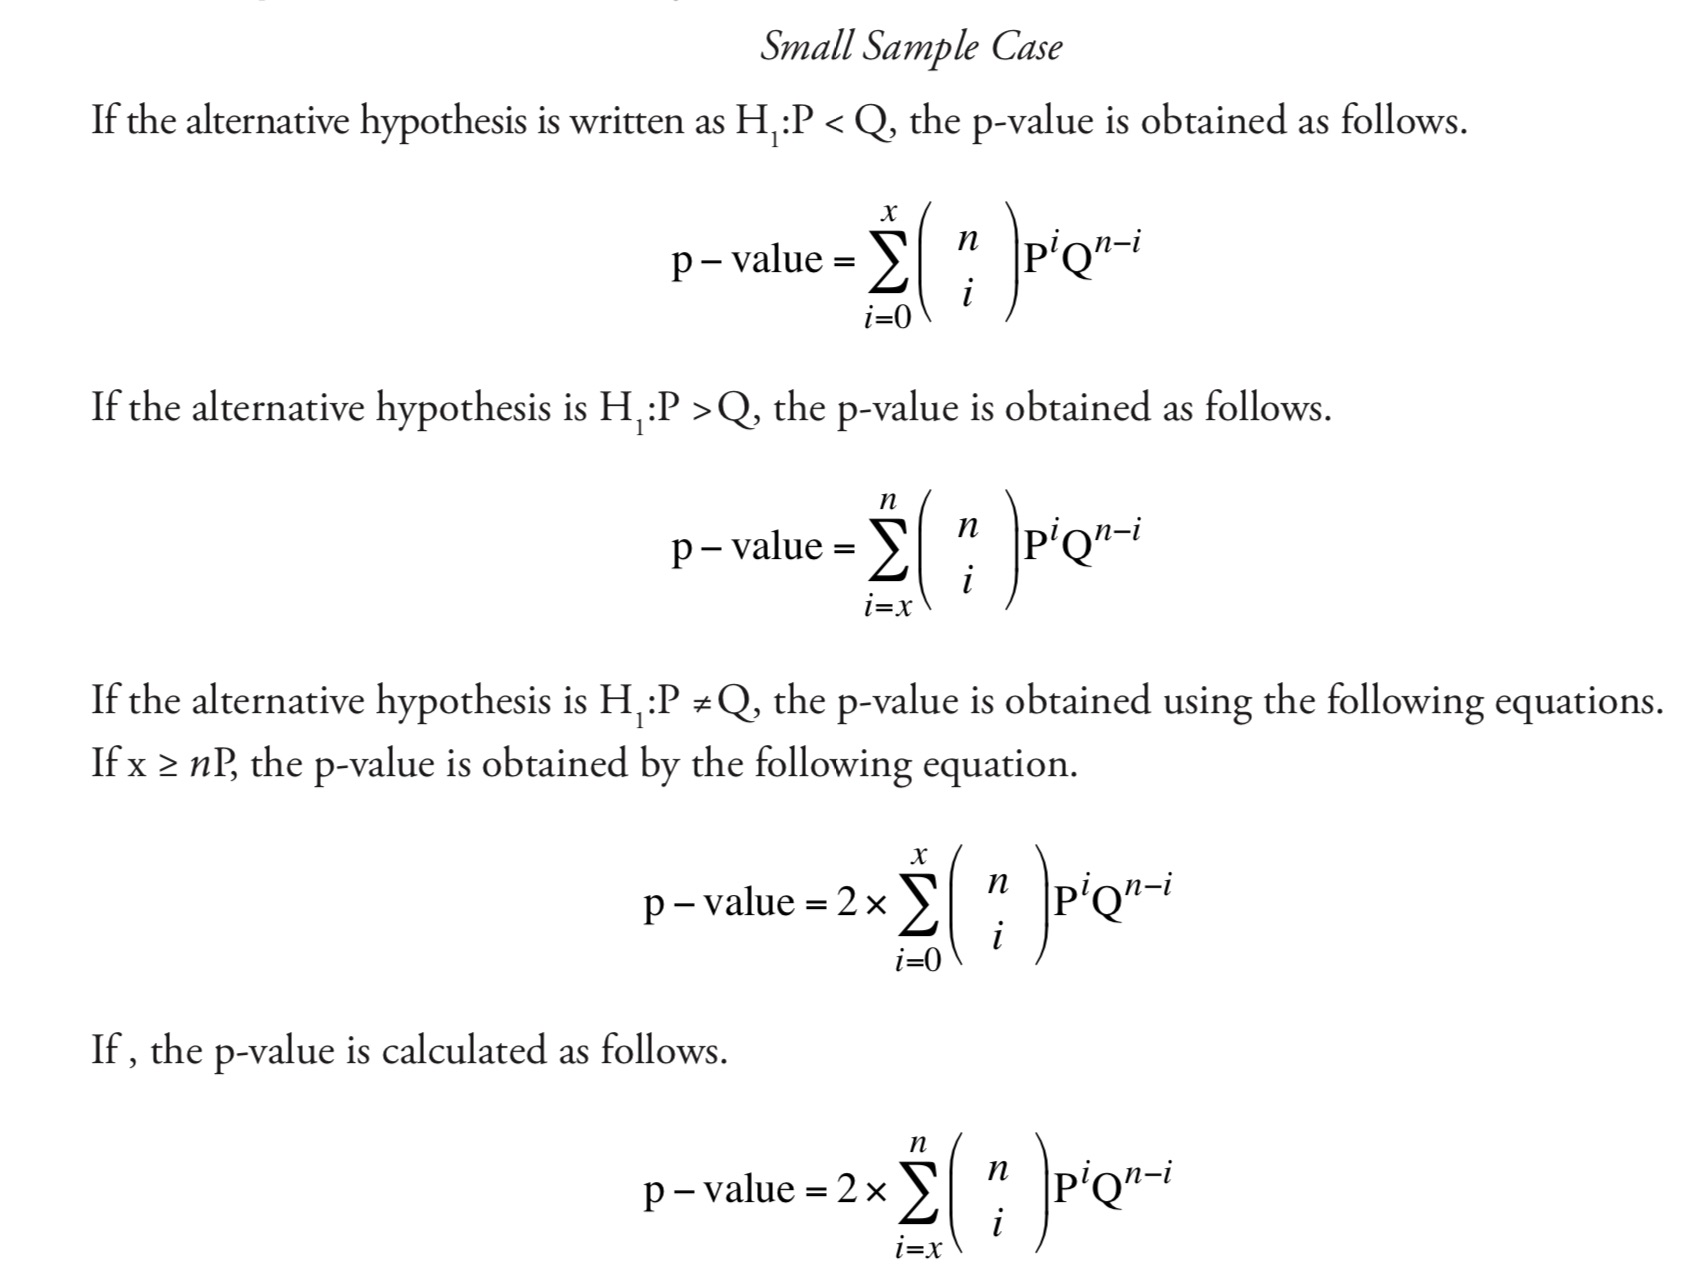
Soru 34
________________ tests are used to determine whether a data set comes from a particular distribution?
Seçenekler
A
t-test
B
z-test
C
Goodness of fit tests
D
ANOVA
E
Regression
Açıklama:
Goodness of fit tests are used to determine whether a data set comes from a particular distribution.
Soru 35
In a Chi-square goodness of fit test, the observed value is 85, the expected value of the same observation is 80, what is the contribution of these values to overall chi-square value?
Seçenekler
A
0.1258
B
0.6578
C
0.3125
D
0.4545
E
0.1595
Açıklama:
single observation contribution is
(85 -80)^2 / 80 = 0.3125
(85 -80)^2 / 80 = 0.3125
Soru 36
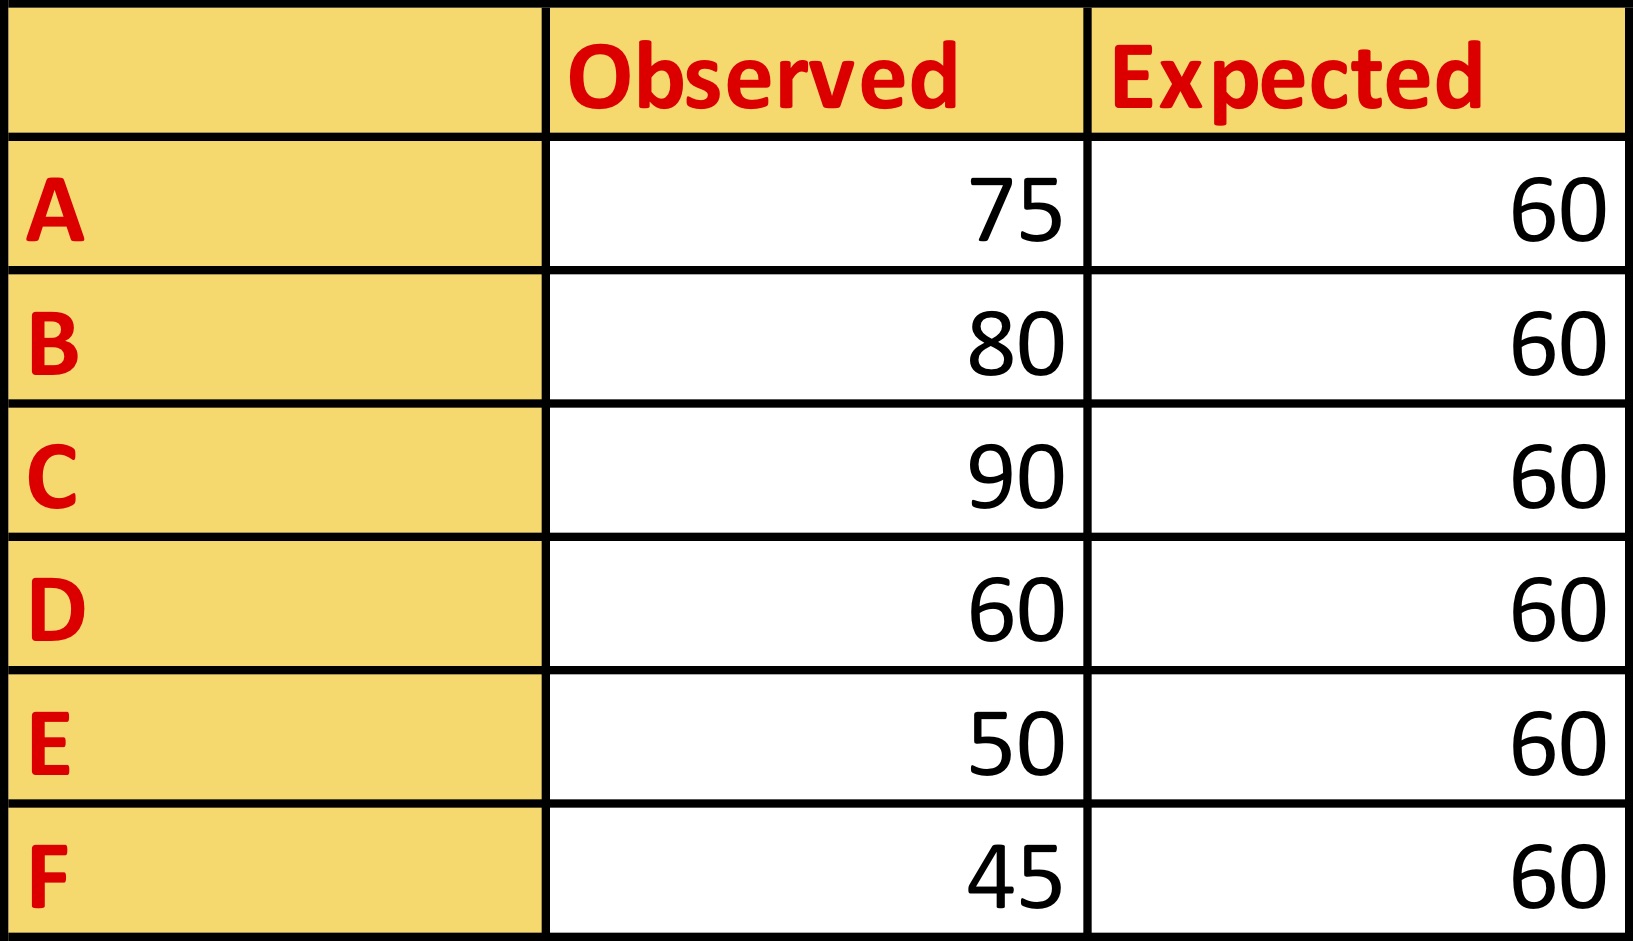 If the Chi-Square goodness of fit test is applied to data in the table, what is the total chi-square value?
Seçenekler
A
32.56
B
38.98
C
30.83
D
45.12
E
65.78
Açıklama:
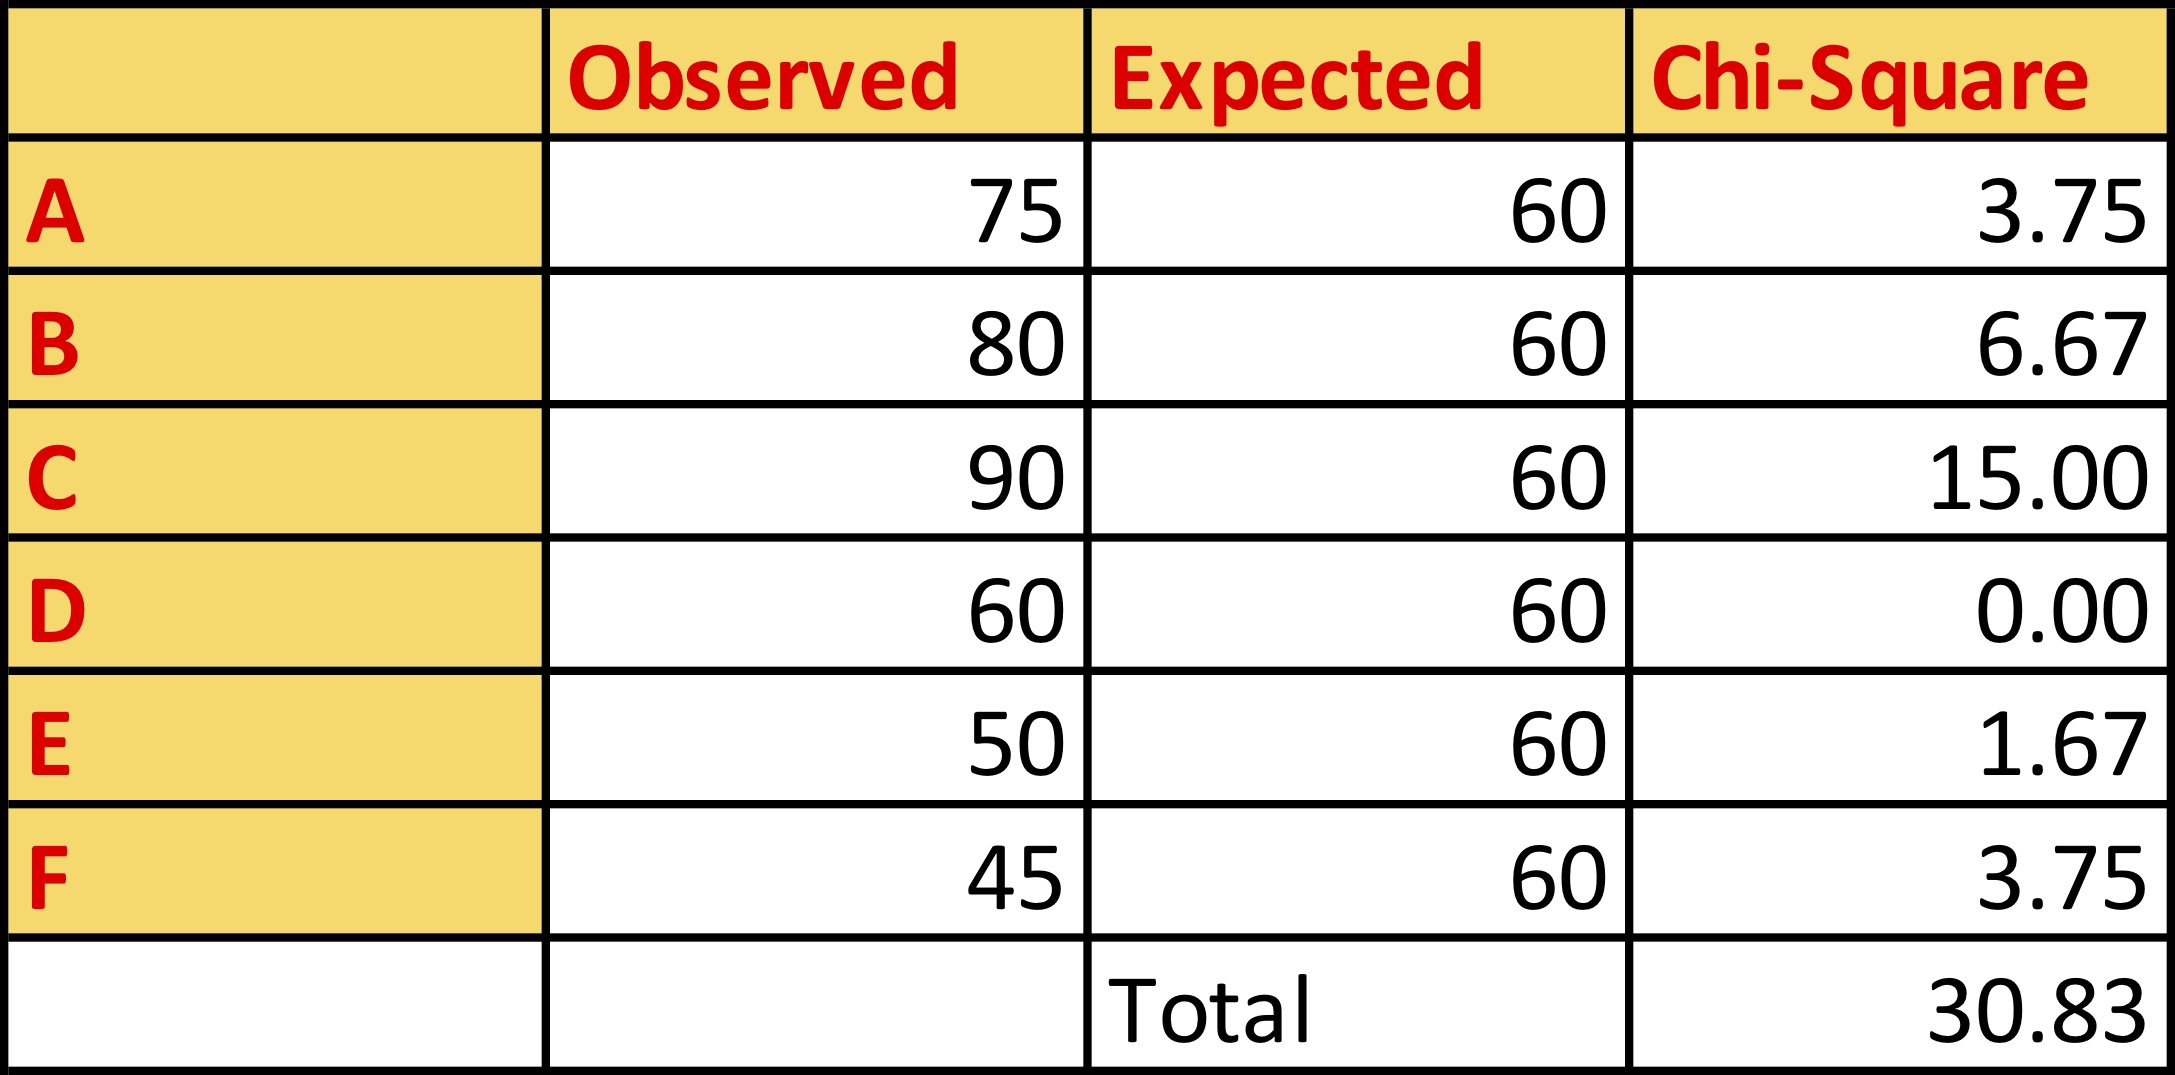
Soru 37
If the degrees of freedom is 10 and right tale area is 0.10, what is the chi-square value from the chi-square table?
Seçenekler
A
15.987
B
14.684
C
17.275
D
17.535
E
16.750
Açıklama:
You need to use the table 7.3 in page 167 of your course book.
Soru 38
What is the non-parametric alternative of t test?
Seçenekler
A
ANOVA
B
Chi-Square
C
Mann-Whitney dependence
D
Wilcoxon Rank Sum Test
E
Binomial
Açıklama:
The parametric independent samples t test is based on several assumptions: two samples are independent of each other, the populations in the investigation for t test are normally distributed, and two populations that these two samples are taken from has the same variability. The Wilcoxon rank sum test is a non- parametric alternative test that involves less assumptions. Especially it does not require that our two populations have a specific known distribution. As long as the populations in question are independent and has the same variability, you may use Wilcoxon Rank Sum test. Therefore, if you want to know if two samples come from independent populations, this method is a good choice. Wilcoxon rank sum test assumes that the two population distributions are identical, although they may differ in location parameter, such as one distribution may be shifted to the right or to the left of the other distribution.
Soru 39
In Wilcoxon Rank Sum Test n1=45 and n2=40 then what is the value of E[S]?
Seçenekler
A
2000
B
1935
C
1800
D
1725
E
1635
Açıklama:
E(S)=(45*(45+40+1))/2=1935
Soru 40
In Wilcoxon Signed Rank Test if n=25 then what is the value of E[S]?
Seçenekler
A
185.50
B
162.50
C
142.50
D
132.50
E
122.50
Açıklama:
25*(25+1)/4=162.50
Soru 41
If we know the proportion P for one class, the proportion of Q for the other class must be equal to which of the following below?
Seçenekler
A
1-P
B
1-Q
C
Q-P
D
1+P
E
1+Q
Açıklama:
You may have noticed that the outcomes of some variables are restricted to two outcomes such as male-female, clean-dirty, and broken-not broken etc. If you carefully study the environment we live in, you may see that sometimes populations consist of only two categories/classes or two subpopulations. For example, as we said before, such classes are male and female, dead and alive, married and not married. The population proportions of two categories/classes are denoted by, in general, P and Q. If we know the proportion P for one class, the proportion of Q for the other class must be equal to 1 - P. Because the total probability must be equal to 1 and there are only two possible outcomes. The correct answer is A.
Soru 42
If the proportion of married people in a group is 0.63, what is the proportion of single people in the group?
Seçenekler
A
0.17
B
0.27
C
0.37
D
0.50
E
0.63
Açıklama:
If we know the proportion P for one class, the proportion of Q for the other class must be equal to 1 - P. Because the total probability must be equal to 1 and there are only two possible outcomes. For example, if the proportion of married people in a group is P = 0.63 then the proportion of the single in that group is Q=1-P = 1- 0.63 = 0.37. The correct answer is C.
Soru 43
What kind of distribution is used when a probability of obtaining an outcome, out of two outcomes, on one trial is known and a probability of the number of times the same outcome might appear, say x times out of n independent trials is tried to be found?
Seçenekler
A
The Binominal Distribution
B
The Sign Test
C
The Chisquare Goodness of Fit Test
D
Wilcoxon Rank Sum Test
E
Kruskal-Wallis Test
Açıklama:
There is a specific distribution called binomial distribution. The Binomial distribution is used when a probability of obtaining an outcome, out of two outcomes, on one trial is known and a probability of the number of times the same outcome might appear, say x times out of n independent trials is tried to be found. Mainly the binomial distribution is the sampling distribution of the proportions estimated from sample data. The binomial test tells us whether it is reasonable to conclude that the proportions we obtain from our sample could have been drawn from a population with a particular value of P. The correct answer is A.
Soru 44
It is based on the agreement between the distribution of a set of observed values and some particular theoretical distribution. This one sample test determines whether the scores in the sample come from a population with theoretical distribution.
Which of the following tests is described above?
Which of the following tests is described above?
Seçenekler
A
The Chi-square Goodness of Fit Test
B
The Kolmogorov- Smirnov Test
C
Kruskal-Wallis Test
D
Wilcoxon Signed Rank Test
E
Wilcoxon Rank Sum Test
Açıklama:
The Kolmogorov-Smirnov test is another goodness of fit test. It is based on the agreement between the distribution of a set of observed values and some particular theoretical distribution. The KolmogorovSmirnov one sample test determines whether the scores in the sample come from a population with theoretical distribution. The test compares the observed cumulative frequency distribution with the cumulative frequency distribution which would occur under the null hypothesis. In Kolmogorov-Smirnov test, the level of measurement for data is at least ordinal. This is the power of Kolmogorov-Smirnov test. The correct answer is B.
Soru 45
Which of the following hypotheses does NOT belong to Wilcoxon Rank Sum Test?
Seçenekler
A
The two populations are identical.
B
The first population is shifted to the right of the second population.
C
The first population is shifted to the left of the second population.
D
The first and the second populations are shifted from each other
E
The population distribution is Uniform.
Açıklama:
In Wilcoxon Rank Sum Test, Ithe alternative hypotheses are constructed in three different ways. The hypotheses are shown as follows.
H0 : The two populations are identical
H1a : The first population is shifted to the right of the second population
H1b : The first population is shifted to the left of the second population
H1c : The first and the second populations are shifted from each other
The correct answer is E.
H0 : The two populations are identical
H1a : The first population is shifted to the right of the second population
H1b : The first population is shifted to the left of the second population
H1c : The first and the second populations are shifted from each other
The correct answer is E.
Soru 46
In this test, the alternative hypotheses are constructed in three different ways. The hypotheses are shown as follows.
H0 :The distribution of differences is symmetrical around MD = 0
H1a :The differences tend to be larger than MD = 0
H1b :The differences tend to be smaller than MD = 0
H1c :The differences tend to be larger than MD = 0 or smaller than MD = 0
Which test do the hypotheses given above belong to?
H0 :The distribution of differences is symmetrical around MD = 0
H1a :The differences tend to be larger than MD = 0
H1b :The differences tend to be smaller than MD = 0
H1c :The differences tend to be larger than MD = 0 or smaller than MD = 0
Which test do the hypotheses given above belong to?
Seçenekler
A
The Chi-square Goodness of Fit Test
B
The Sign Test
C
The Wilcoxon Rank Sum Test
D
The Wilcoxon Signed Rank Test
E
Kruskal-Wallis Test
Açıklama:
The Wilcoxon signed rank test, involves the usage of the sign and the magnitude of the rank of the differences between pairs of measurements, and it is a non-parametric alternative to the paired t test when the population distribution of the differences is not normally distributed. In this problem, the results are tied to each other, for example there is an effect, and outcomes of a variable are collected before the effect and after the effect on some observations. For example, a group of patients’ blood pressure can be measured before and after a medicine is taken. Wilcoxon Signed Rank Test does not require the normality assumption that we usually see on a parametric test. Steps of the Method In this test, the alternative hypotheses are constructed in three different ways. The hypotheses are shown as follows. H0 :The distribution of differences is symmetrical around MD = 0 H1a :The differences tend to be larger than MD = 0 H1b :The differences tend to be smaller than MD = 0 H1c :The differences tend to be larger than MD = 0 or smaller than MD = 0. The correct answer is D.
Soru 47
Which test is used to decide whether k independent samples are drawn from different populations?
Seçenekler
A
The Sign Test
B
Kruskal-Wallis Test
C
The Wilcoxon Rank Sum Test
D
The Wilcoxon Signed Rank Test
E
Spearman Rank Correlation Coefficient
Açıklama:
The one-way analysis of variance has some assumptions such as independent samples, normality, and equal variances. When the conditions of normality and equal variances are not valid, Kruskal-Wallis is a non-parametric alternative test that involves less conditions. The Kruskal-Wallis test is used to decide whether k independent samples are drawn from different populations. It is an extension of the Wilcoxon sum rank test to a comparison of more than two populations. The Kruskal-Wallis test assumes that the variable under consideration is measured on at least ordinal scale. The correct answer is B.
Soru 48
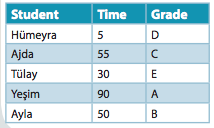 The table shows s the times (in minutes) spent by five students revising for a test and the grades that they achieved in the test. What is Spearman’s rank correlation coefficient?
Seçenekler
A
1
B
0.1
C
0.2
D
0.3
E
0.5
Açıklama:
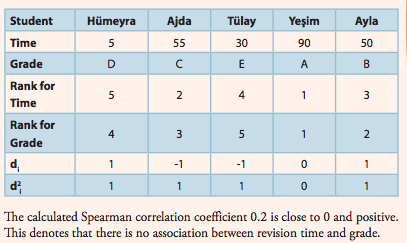
Soru 49
Which of the following can be writen as a null hypothesis for The Chi-square Goodness of Fit Test?
Seçenekler
A
The population distribution is normal distribution.
B
The population distribution is uniform.
C
Distribution for duration of service is uniform distribution.
D
The two populations are identical.
E
The distribution of differences is symmetrical around MD = 0.
Açıklama:
Goodness of fit tests are used to determine whether a data set comes from a particular distribution. Some null and alternative hypotheses examples about the population distributions are given below.
H0 : The population distribution is Normal Distribution
H1 : The population distribution is not Normal Distribution
H0 : The population distribution is Poisson Distribution
H1 : The population distribution is not Poisson Distribution
The correct answer is A.
H0 : The population distribution is Normal Distribution
H1 : The population distribution is not Normal Distribution
H0 : The population distribution is Poisson Distribution
H1 : The population distribution is not Poisson Distribution
The correct answer is A.
Soru 50
The number of thefts occurring in each season (winter, spring, summer, fall) in a province for the last year is given below:
Winter: 15
Spring: 25
Summer: 80
Fall: 70
What is the expected probability according to uniform distribution?
Winter: 15
Spring: 25
Summer: 80
Fall: 70
What is the expected probability according to uniform distribution?
Seçenekler
A
1
B
0.25
C
25
D
0.50
E
50
Açıklama:
In this problem, the classes can be written as winter, spring, summer, and fall. The expected frequencies can be calculated using Uniform distribution. Remember that when the data follows uniform distribution, all the outcome will equally likely. Therefore, all the outcomes on this problem, based on uniform distribution, have a probability of 0.25 since there are four seasons. The expected frequencies can be calculated by multiplying the sample size n with expected probabilities. Hence, the probability for each class is 200 x 0.25 = 50. The correct answer is E.
Ünite 8
Soru 1
The payoff values for decision alternatives : there are 5 states of nature and the profit values for the first decision alternative are 96, 87, 45, 14, 107. The decision maker is optimistic. Which payoff value is taken from the first decision alternative?
Seçenekler
A
14
B
45
C
87
D
96
E
107
Açıklama:
x = max = 107. pg. 190. Correct answer is E.
Soru 2
The payoff values for decision alternatives : there are 5 states of nature and the cost values for the first decision alternative are 69, 17, 54, 16, 34. The decision maker is optimistic. Which payoff value is taken from the first decision alternative?
Seçenekler
A
16
B
17
C
34
D
54
E
69
Açıklama:
x = min = 16 . pg. 190. Correct answer is A.
Soru 3
The payoff values for decision alternatives : there are 5 states of nature and the profit values for the first decision alternative are 66, 27, 104, 91, 87. The decision maker is pessimistic. Which payoff value is taken from the first decision alternative?
Seçenekler
A
104
B
91
C
87
D
66
E
27
Açıklama:
x = min = 27. If the payoff table is based on profits, first for each decision alternative, the minimum payoff value of each decision alternative is listed then among these payoff values the decision alternative producing the maximum is chosen as the best decision alternative. pg. 190. Correct answer is E.
Soru 4
The payoff values for decision alternatives : there are 5 states of nature and the cost values for the first decision alternative are -0.8, -0.9, -0.2, -0.7, -0.6. The decision maker is pessimistic. Which payoff value is taken from the first decision alternative?
Seçenekler
A
-0.2
B
-0.6
C
-0.7
D
-0.8
E
-0.9
Açıklama:
x = max = -0.2 . If the payoff table is based on costs, first for each decision alternative, the maximum payoff value of each decision alternative is listed then among these payoff values the decision alternative producing the minimum is chosen as the best decision alternative. pg. 190. Correct answer is A.
Soru 5
The payoff values for decision alternatives : there are 5 states of nature and minimum payoff values for 5 decision alternatives are I) 11.650, II) 10.025, III) 5.275, IV) 2.725, V) 3.450. The decision maker is pessimistic. Which decision alternative is choosen?
Seçenekler
A
I
B
II
C
III
D
IV
E
V
Açıklama:
x = max = I : 11.650 . pg. 190 . Correct answer is A.
Soru 6
The payoff values for decision alternatives : there are 5 states of nature and maximum payoff values for 5 decision alternatives are I) -0.15, II) -0.11, III) -0.72, IV) -0.27, V) -0.34. The decision maker is pessimistic. Which decision alternative is choosen?
Seçenekler
A
I
B
II
C
III
D
IV
E
V
Açıklama:
x = min = III : -0.72 . pg. 190 . Correct answer is C.
Soru 7
Decision maker defines the coefficient of optimism as 0.34 , then what is the coefficient of pessimism?
Seçenekler
A
0.17
B
0.34
C
0.66
D
0.68
E
0.83
Açıklama:
x = 1 - 0.34 = 0.66 . pg. 194 . Correct answer is C.
Soru 8
The payoff values for decision alternatives : there are 5 states of nature and the cost value for the first decision alternative is 12 according to optimist and 15 according to pessimist. If coefficient of optimism is 0.2, what is payoff value for the first decision alternative?
Seçenekler
A
13.50
B
13.80
C
14.10
D
14.25
E
14.40
Açıklama:
x = 12 . 0.2 + 15 . (1 - 0.2) = 2.4 + 12 = 14.4 . pg. 194 . Correct answer is E.
Soru 9
The payoff values for decision alternatives : there are 5 states of nature and the profit value for the first decision alternative is 15 according to optimist and 12 according to pessimist. If coefficient of optimism is 0.6, what is payoff value for the first decision alternative?
Seçenekler
A
14.25
B
14.00
C
13.80
D
13.75
E
13.45
Açıklama:
x = 15 . 0.6 + 12 (1 - 0.6) = 9 + 4.8 = 13.8 . pg. 194 . Correct answer is C.
Soru 10
A decision alternative has 2 and 4 as payoff values and the probabilities of the associated states of nature are 0.25 and 0.75 respectively. What is the expected monetary value of this decision alternative?
Seçenekler
A
2.25
B
2.75
C
3.25
D
3.50
E
3.75
Açıklama:
x = 2 . 0.25 + 4 . 0.75 = 0.50 + 3 = 3.5 . pg. 197 . Correct answer is D.
Soru 11
Answer the questions 1-4 according to the following situation.
The weather can be either snowy, rainy or sunny tomorrow morning. Ahmet can go to work either by bus or by his own car. If the weather is sunny and he goes to work by his own car, it will take 10 minutes and if he chooses to go by bus it will take 20 minutes. On the other hand if the weather is rainy his own car will take 15 minutes and the bus will take 25 minutes to go to work. Finally, if the weather is snowy car option takes 20 minutes and bus option takes 35 minutes.
The duration (time) of going to work is an example of ........
Seçenekler
A
State of nature
B
Nature of state
C
Payoff
D
Decision alternative
E
Payroll
Açıklama:
The time it take for him to go to work in different weather conditions and different vehicles is an example of payoff.
Soru 12
For Ahmet going work by either bus or his own car are examples of .......
Seçenekler
A
State of natüre
B
Nature of state
C
Payoff
D
Decision alternative
E
Payroll
Açıklama:
Since vehicles are substitute to each other, they are different decison alternatives.
Soru 13
The weather conditions in this decision problem are examples of .....
Seçenekler
A
State of natüre
B
Nature of state
C
Payoff
D
Decision alternative
E
Payroll
Açıklama:
Different weather conditions are examples of state of nature.
Soru 14
If Wi stands for the weather type and Vi stands for the vehicle choosen by Ahmet to go to work, how will his payoff matrix would look like?
Seçenekler
A
| Sunny (W1) | Rainy (W2) | Snowy (W3) | |
| By Car(V1) | 10 | 15 | 20 |
| By Bus(V2) | 20 | 25 | 35 |
B
| Sunny (W1) | Rainy (W2) | Snowy (W3) | |
| By Car(V1) | 15 | 15 | 20 |
| By Bus(V2) | 20 | 30 | 35 |
C
| Sunny (W1) | Rainy (W2) | Snowy (W3) | |
| By Car(V1) | 20 | 25 | 20 |
| By Bus(V2) | 10 | 35 | 35 |
D
| Sunny (W1) | Rainy (W2) | Snowy (W3) | |
| By Car(V1) | 15 | 25 | 35 |
| By Bus(V2) | 20 | 25 | 45 |
E
| Sunny (W1) | Rainy (W2) | Snowy (W3) | |
| By Car(V1) | 10 | 20 | 30 |
| By Bus(V2) | 15 | 25 | 35 |
Açıklama:
The correct payoff matrix which show different duration of going to work under different weather conditions and with different alternatives of vehicles is shown in A.
Soru 15
Under this optimistic criterion, the decision maker calculates the best possible payoff for each decision alternative (among all possible states of nature, for that specific alternative), and then he/she chooses the decision that has the maximum best possible outcome. Which criterion is this?
Seçenekler
A
Minimax
B
Maximin
C
Maximax
D
Minimin
E
Optimum
Açıklama:
It is the maximax criterion because the decision maker chooses the maximum payoff value for each alternative and selects the action which provides highest of these.
Soru 16
According to which criterion a decision maker choose that course of action which minimizes the minimum possible pay - offs?
Seçenekler
A
Minimax
B
Maximin
C
Maximax
D
Minimin
E
Optimum
Açıklama:
The defined criterion is the minimin, which suggests to choose the action with possible minimum payoff.
Soru 17
Answer the questions 7-8 according to following information.
A company has 5 different alternative actions denoted by A1, A2,..A5 under 3 possible states of nature, which are denoted by S1, S2 and S3. The pay off matrix for each action and state of nature is given as: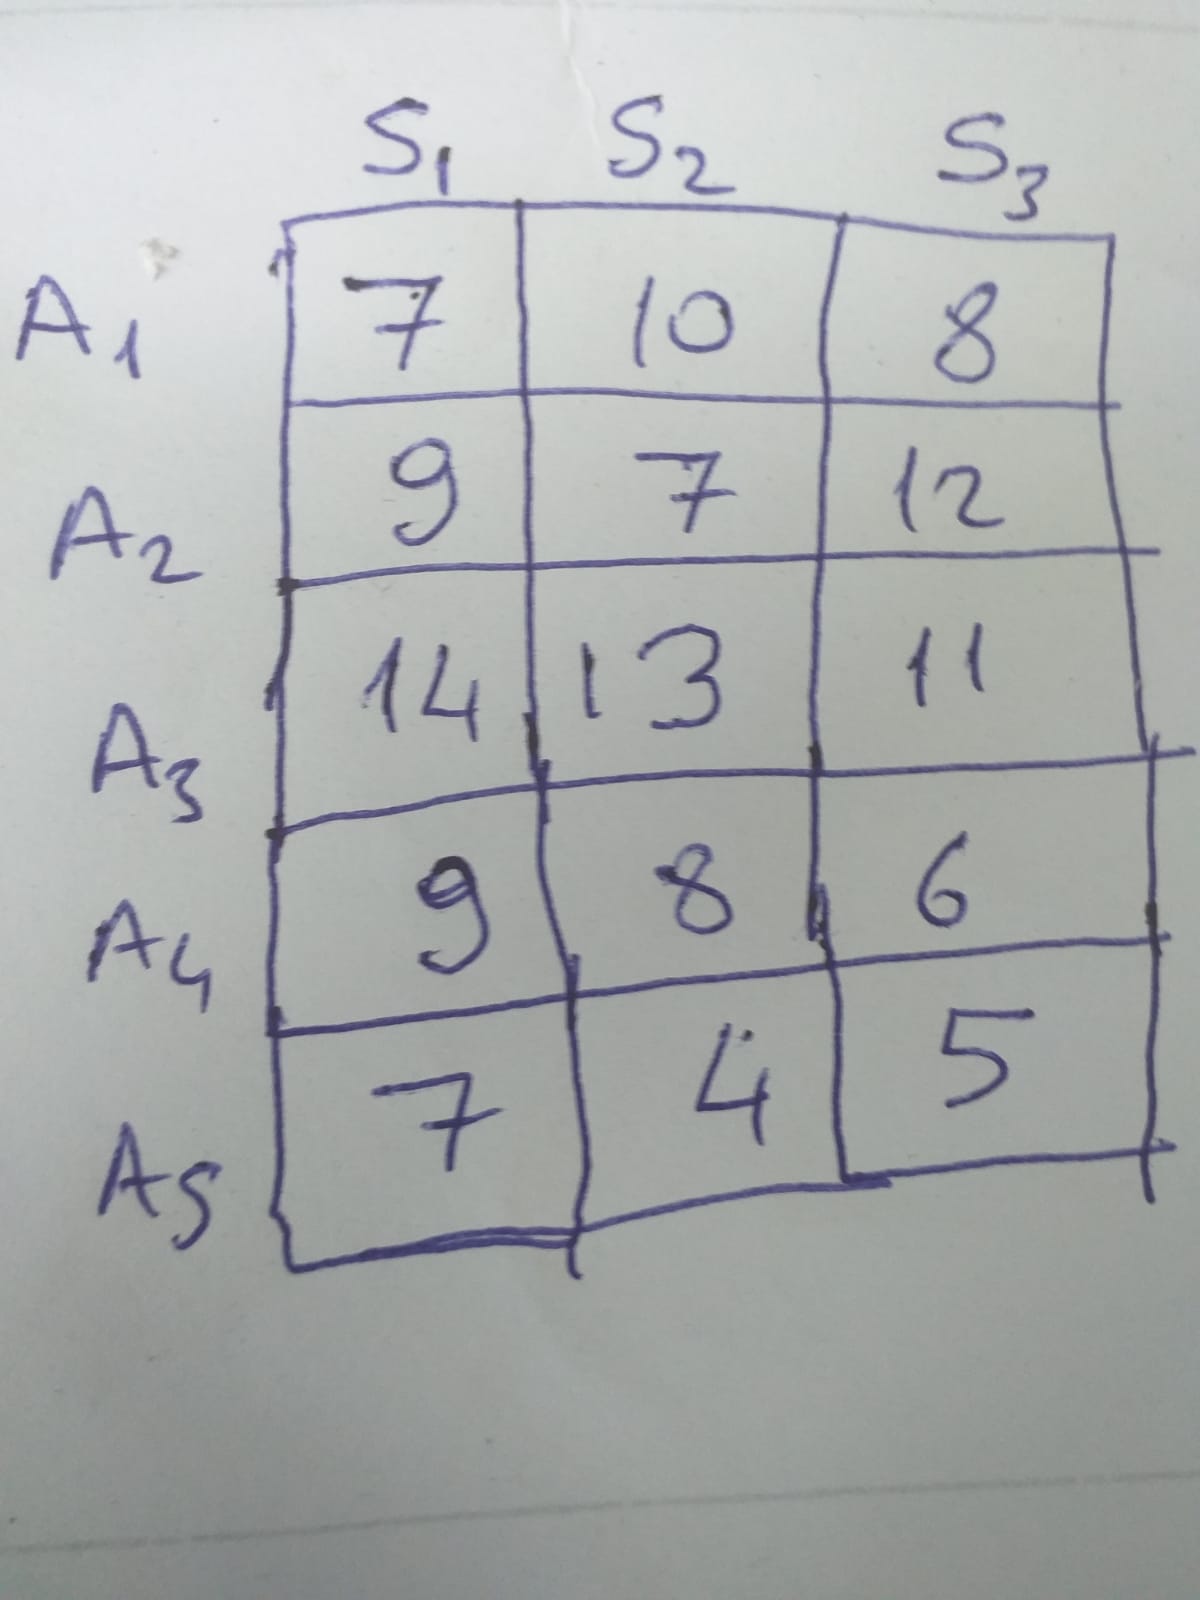
What will be the best action under maximax criterion?
A company has 5 different alternative actions denoted by A1, A2,..A5 under 3 possible states of nature, which are denoted by S1, S2 and S3. The pay off matrix for each action and state of nature is given as:
What will be the best action under maximax criterion?
Seçenekler
A
A1
B
A2
C
A3
D
A4
E
A5
Açıklama:
maxA1=max(7,10,8)=10
maxA2=max(9,7,12)=12
maxA3=max(14,13,11)=14*
maxA4=max(9,8,6)=9
maxA5=max(7,4,5)=7
Thus A3 gives the maximum of maximum possible payoffs.
maxA2=max(9,7,12)=12
maxA3=max(14,13,11)=14*
maxA4=max(9,8,6)=9
maxA5=max(7,4,5)=7
Thus A3 gives the maximum of maximum possible payoffs.
Soru 18
What would be the best action under minimin criterion?
Seçenekler
A
A1
B
A2
C
A3
D
A4
E
A5
Açıklama:
MinA1=min(7,10,8)=7
MinA2=min(9,7,12)=7
MinA3=min(14,13,11)=11
MinA4=min(9,8,6)=6
MinA5=min(7,4,5)=4
Thus action 5 gives the minimum of the minimum possible payoffs.
MinA2=min(9,7,12)=7
MinA3=min(14,13,11)=11
MinA4=min(9,8,6)=6
MinA5=min(7,4,5)=4
Thus action 5 gives the minimum of the minimum possible payoffs.
Soru 19
In which criterion a level of optimism (alpha) is attained for the maximum value of each action, 1-alpha to minimum value and then a weighted average payoff is calculated?
Seçenekler
A
Hurwicz's
B
Wald's
C
Plunger's
D
Shorrock's
E
Tucker's
Açıklama:
It's the Hurwic's criterion. The average payoff=α *Max+(1-α )Min
Soru 20
For a company, 3 different states of nature are given as S1, S2 and S3 with possibilities 0.4, 0.5 and 0.1 respectively. The alternative actions on the other hand are given as A1, A2, and A3. What will be the best action provides the highest expected payoff and what will be the expected payoff given that action is taken; if the payoff matrix is given as:
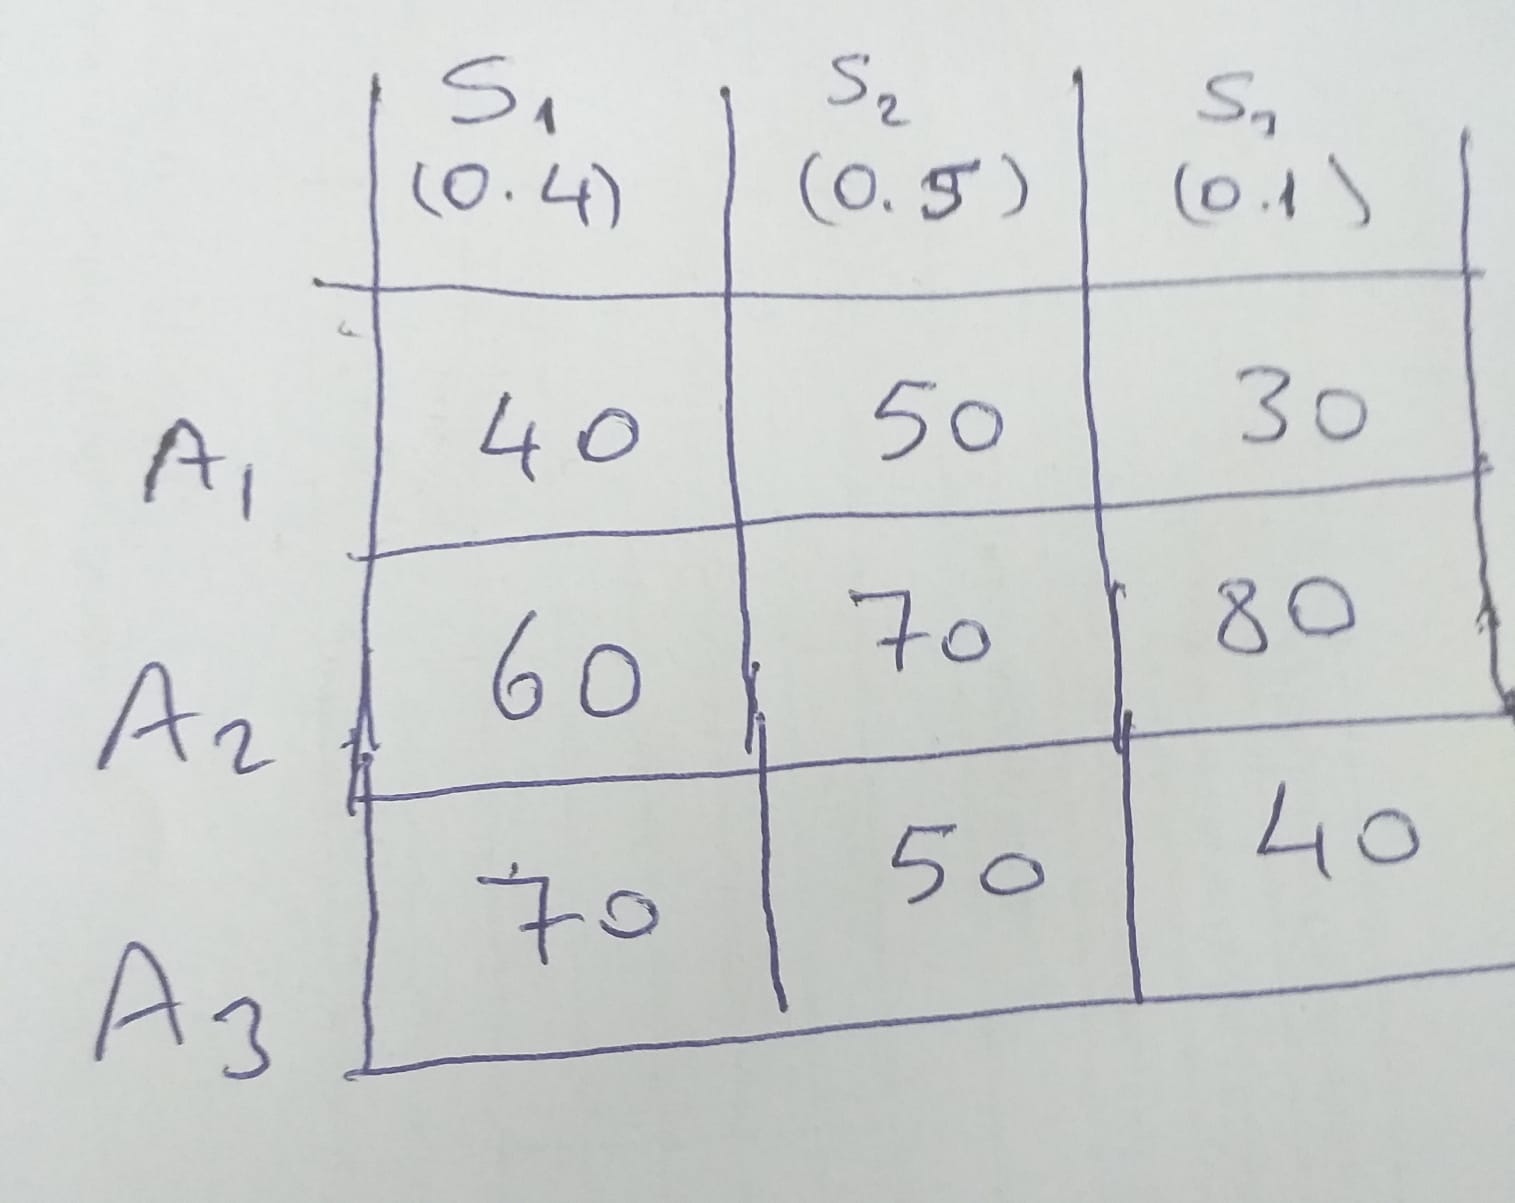
Seçenekler
A
A1, with expected pay off=44
B
A2, with expected pay-off=67
C
A2, with expected pay-off=57
D
A3, with expected pay-off=70
E
A3, with expected pay-off=57
Açıklama:
Action A2 gives the maximum expected pay off which is equal to 60*0.4+70*0.5+80*0.1=67. The expected pay offs of A1 and A3 are 44 and 57 respectively.
Soru 21
Which of the followings is the first step in decision making process?
Seçenekler
A
Finding out about the “states of world”, or “states of nature”.
B
Investigating about the alternatives to solve the decision problem.
C
Defining the decision problem.
D
Calculating a payoff value.
E
Creating payoff matrix or decision table.
Açıklama:
COMPONENTS OF DECISION PROBLEM
The first step is to define the decision problem. We need to clearly identify our decision problem and study all the characteristic of the decision problem. We should ensure that when the decision problem is laid out everyone should understand the same think. There should be no debatable points on what the extend of the decision problem is and what is the size of the decision problem etc.
The first step is to define the decision problem. We need to clearly identify our decision problem and study all the characteristic of the decision problem. We should ensure that when the decision problem is laid out everyone should understand the same think. There should be no debatable points on what the extend of the decision problem is and what is the size of the decision problem etc.
Soru 22
In which of the following decision making environment, the decision maker can list all the states of nature that are possible in the decision problem but cannot assign any probability value to the specific state of nature that might happen?
Seçenekler
A
Decision making under certainty
B
Decision making under uncertainty
C
Decision making under risk
D
Decision making under stress
E
Decision making under control
Açıklama:
COMPONENTS OF DECISION PROBLEM
The second decision making environment is decision making under uncertainty. In this environment, the decision maker can list all the states of nature that are possible in the decision problem but cannot assign any probability value to the specific state of nature that might happen.
The second decision making environment is decision making under uncertainty. In this environment, the decision maker can list all the states of nature that are possible in the decision problem but cannot assign any probability value to the specific state of nature that might happen.
Soru 23
In which of the following decision making environment, the decision maker is able to assign probabilities to states of nature?
Seçenekler
A
Decision making under certainty
B
Decision making under uncertainty
C
Decision making under risk
D
Decision making under stress
E
Decision making under control
Açıklama:
COMPONENTS OF DECISION PROBLEM
The last decision making environment is decision making under risk. In this setting the decision maker is able to assign probabilities to states of nature. In this environment, decision maker assigns a probability to each state of nature, therefore decision maker is able to calculate how much risk is taken if that state of nature happens.
The last decision making environment is decision making under risk. In this setting the decision maker is able to assign probabilities to states of nature. In this environment, decision maker assigns a probability to each state of nature, therefore decision maker is able to calculate how much risk is taken if that state of nature happens.
Soru 24
In which of the following approaches; decision maker creates the payoff table based on either profit or cost for each combination of decision alternative and state of nature, chooses the maximum or minimum payoff value for each decision alternative, and selects the decision alternative that gives the highest or lowest of these payoffs.
Seçenekler
A
Optimistic Approach
B
Pessimistic Approach
C
The Hurwicz Criterion
D
Expected Monetary Value
E
Decision Tree
Açıklama:
DECISION MAKING UNDER UNCERTAINITY
As the name implies, in optimistic approach, decision maker thinks that all the good things will happen. Decision maker creates the payoff table based on either profit or cost for each combination of decision alternative and state of nature. Then, the decision maker chooses the maximum or minimum payoff value for each decision alternative, and then decision maker selects the decision alternative that gives the highest or lowest of these payoffs. This method is also known as Plunger’s optimism criterion.
As the name implies, in optimistic approach, decision maker thinks that all the good things will happen. Decision maker creates the payoff table based on either profit or cost for each combination of decision alternative and state of nature. Then, the decision maker chooses the maximum or minimum payoff value for each decision alternative, and then decision maker selects the decision alternative that gives the highest or lowest of these payoffs. This method is also known as Plunger’s optimism criterion.
Soru 25
Which of the followings happen if the payoff matrix is based on costs?
Seçenekler
A
First the maximum payoff value of each decision alternative is found then among these payoff values, the decision alternative producing the maximum is chosen as the best decision alternative.
B
First the minimum payoff value of each decision alternative is found then among these payoff values the decision alternative producing the minimum is chosen as the best decision alternative.
C
Decision maker creates the payoff matrix using the cost values that might be realised for each combination of decision alternative and state of nature.
D
First for each decision alternative, the minimum payoff value of each decision alternative is listed then among these payoff values the decision alternative producing the maximum is chosen as the best decision alternative.
E
first for each decision alternative, the maximum payoff value of each decision alternative is listed then among these payoff values the decision alternative producing the minimum is chosen as the best decision alternative.
Açıklama:
Maximin and Minimax Criterions (Pessimistic Approach)
If the payoff matrix is based on costs, first the minimum payoff value of each decision alternative is found then among these payoff values the decision alternative producing the minimum is chosen as the best decision alternative.
If the payoff matrix is based on costs, first the minimum payoff value of each decision alternative is found then among these payoff values the decision alternative producing the minimum is chosen as the best decision alternative.
Soru 26
Which of the followings will show you all the possible decision alternatives of the problem, all the states of nature and the payoff values for each of alternative and states of nature combination as a manager in a company and want to invest/build a new factory?
Seçenekler
A
Payoff Matrix
B
Decision Tree
C
Decision Node
D
Chance Node
E
End Node
Açıklama:
Constructing payoff matrix
If you are a manager in a company and want to invest/build a new factory, there are many parameters to think about. There are also different conditions that will affect the result of your decision alternative. The payoff matrix will show you all the possible decision alternatives of the problem, all the states of nature and the payoff values for each of alternative and states of nature combination.
If you are a manager in a company and want to invest/build a new factory, there are many parameters to think about. There are also different conditions that will affect the result of your decision alternative. The payoff matrix will show you all the possible decision alternatives of the problem, all the states of nature and the payoff values for each of alternative and states of nature combination.
Soru 27
Which of the following statements is not true regarding decision making?
Seçenekler
A
The decision maker lists all the possible decision alternatives and also knows all the possible states of nature that may be realized in decision making problem.
B
Decision maker studies the problem extensively to be ale to find the states of nature the states of nature that can be seen in the decision-making process.
C
Decision maker knows what the states of nature are in the decision problem and able to assign a probability value to any of states of nature.
D
There are decision alternatives and states of nature, but we don’t know which state of nature really might happen and even we cannot put a probability to any of the states of nature that might happen in the future.
E
There are different approaches to solve the decision making problems.
Açıklama:
Making a decision under uncertainty
Decision maker knows what the states of nature are in the decision problem but not able to assign a probability value to any of states of nature.
Decision maker knows what the states of nature are in the decision problem but not able to assign a probability value to any of states of nature.
Soru 28
Which of the following statements is not true regarding making a decision?
Seçenekler
A
We are able to assign any probability of occurrence to any of the states of nature.
B
There is a complete uncertainty for the decision maker.
C
When the decision maker is faced with a decision with two or more decision alternatives, decision maker starts to investigate the components of the decision problem.
D
If the decision maker is able to assign the probabilities to states of nature, then it is said that the decision is made under the risk environment.
E
Decision maker usually looks at the past data to assign the probabilities to the states of nature.
Açıklama:
Making a decision under risk
We are not able to assign any probability of occurrence to any of the states of nature.
We are not able to assign any probability of occurrence to any of the states of nature.
Soru 29
Which of the following consequences most probably occurs if the probability values are obtained from an outside firm?
Seçenekler
A
The payoff matrix will show you all the possible decision alternatives of the problem.
B
The amount of money spent on the process should be incorporated into the payoff matrix calculations.
C
Branches of the chance nodes of the decision tree of the decision problem do not include the probabilities.
D
A chance node might be followed by a decision node.
E
The appropriate payoff value is written.
Açıklama:
Making a decision under risk
If the probability values are obtained from an outside firm, then the amount of money spent on the process should be incorporated into the payoff matrix calculations.
If the probability values are obtained from an outside firm, then the amount of money spent on the process should be incorporated into the payoff matrix calculations.
Soru 30
Which of the followings happen once the path is identified, from the payoff matrix?
Seçenekler
A
The maximum payoff value of each decision alternative is listed then among these payoff values the decision alternative producing the minimum is chosen as the best decision alternative.
B
The decision alternative producing the maximum of the expected values is chosen as the best decision alternative.
C
The decision alternative producing the minimum of the expected values is chosen as the best decision alternative
D
The interpretation of the decision tree gets complicated.
E
The appropriate payoff value is written.
Açıklama:
Decision Tree
End node: end note is represented with vertical line ( | ). Next to the end nodes, the payoff values are written. The payoff value to be written is found by following the path from the main decision node to the end node. Once the path is identified, from the payoff matrix, the appropriate payoff value is written.
End node: end note is represented with vertical line ( | ). Next to the end nodes, the payoff values are written. The payoff value to be written is found by following the path from the main decision node to the end node. Once the path is identified, from the payoff matrix, the appropriate payoff value is written.
Soru 31
The payoff values for decision alternatives : there are 6 states of nature and the profit values for the first decision alternative are 690, 780, 540, 410, 710, 320. The decision maker is optimistic. Which payoff value is taken from the first decision alternative?
Seçenekler
A
410
B
540
C
710
D
780
E
320
Açıklama:
x = max = 780. pg. 190. Correct answer is D.
Soru 32
The payoff values for decision alternatives : there are 6 states of nature and the cost values for the first decision alternative are 960, 710, 450, 610, 430, 580. The decision maker is optimistic. Which payoff value is taken from the first decision alternative?
Seçenekler
A
610
B
710
C
450
D
960
E
430
Açıklama:
x = min = 430 . pg. 190. Correct answer is E.
Soru 33
The payoff values for decision alternatives : there are 6 states of nature and the profit values for the first decision alternative are 550, 720, 410, 190, 780, 260. The decision maker is pessimistic. Which payoff value is taken from the first decision alternative?
Seçenekler
A
550
B
260
C
780
D
190
E
720
Açıklama:
x = min = 190. If the payoff table is based on profits, first for each decision alternative, the minimum payoff value of each decision alternative is listed then among these payoff values the decision alternative producing the maximum is chosen as the best decision alternative. pg. 190. Correct answer is D.
Soru 34
The payoff values for decision alternatives : there are 6 states of nature and the cost values for the first decision alternative are -0.75, -0.85, -0.15, -0.65, -0.55, -0.05. The decision maker is pessimistic. Which payoff value is taken from the first decision alternative?
Seçenekler
A
-0.15
B
-0.55
C
-0.75
D
-0.85
E
-0.05
Açıklama:
x = max = -0.05 . If the payoff table is based on costs, first for each decision alternative, the maximum payoff value of each decision alternative is listed then among these payoff values the decision alternative producing the minimum is chosen as the best decision alternative. pg. 190. Correct answer is E.
Soru 35
The payoff values for decision alternatives : there are 5 states of nature and minimum payoff values for 6 decision alternatives are I) 61.150, II) 90.125, III) 20.575, IV) 70.225, V) 40.350, VI) 14.750. The decision maker is pessimistic. Which decision alternative is choosen?
Seçenekler
A
I
B
II
C
III
D
IV
E
VI
Açıklama:
x = max = II : 90.125 . pg. 190 . Correct answer is B.
Soru 36
The payoff values for decision alternatives : there are 5 states of nature and maximum payoff values for 6 decision alternatives are I) -0.51, II) -0.22, III) -0.36, IV) -0.14, V) -0.43, VI) -0.87 . The decision maker is pessimistic. Which decision alternative is choosen?
Seçenekler
A
IV
B
VI
C
II
D
V
E
I
Açıklama:
x = min = VI : -0.87 . pg. 190 . Correct answer is B.
Soru 37
Decision maker defines the coefficient of optimism as 0.26 , then what is the coefficient of pessimism?
Seçenekler
A
0.13
B
0.48
C
0.74
D
0.87
E
0.52
Açıklama:
x = 1 - 0.26 = 0.74 . pg. 194 . Correct answer is C.
Soru 38
The payoff values for decision alternatives : there are 6 states of nature and the cost value for the first decision alternative is 20 according to optimist and 30 according to pessimist. If coefficient of optimism is 0.3, what is payoff value for the first decision alternative?
Seçenekler
A
27
B
22
C
26
D
24
E
28
Açıklama:
x = 20 . 0.3 + 30 . (1 - 0.3) = 6 + 21 = 27 . pg. 194 . Correct answer is A.
Soru 39
The payoff values for decision alternatives : there are 6 states of nature and the profit value for the first decision alternative is 30 according to optimist and 20 according to pessimist. If coefficient of optimism is 0.8, what is payoff value for the first decision alternative?
Seçenekler
A
24
B
27
C
28
D
25
E
26
Açıklama:
x = 30 . 0.8 + 20 (1 - 0.8) = 24 + 4 = 28 . pg. 194 . Correct answer is C.
Soru 40
A decision alternative has 15 and 35 as payoff values and the probabilities of the associated states of nature are 0.6 and 0.4 respectively. What is the expected monetary value of this decision alternative?
Seçenekler
A
23
B
28
C
24
D
21
E
29
Açıklama:
x = 15 . 0.6 + 35 . 0.4 = 9 + 14 = 23 . pg. 197 . Correct answer is A.
Soru 41
The payoff values for decision alternatives : there are 5 states of nature and the profit values for the first decision alternative are 69, 78, 54, 40, 87. The decision maker is optimistic. Which payoff value is taken from the first decision alternative?
Seçenekler
A
87
B
78
C
69
D
54
E
40
Açıklama:
x = max = 87 . pg 190. Correct answer is A.
Soru 42
The payoff values for decision alternatives : there are 5 states of nature and the cost values for the first decision alternative are 96, 87, 45, 60, 78. The decision maker is optimistic. Which payoff value is taken from the first decision alternative?
Seçenekler
A
96
B
87
C
78
D
60
E
45
Açıklama:
x = min = 45 . pg 190. Correct answer is E.
Soru 43
The payoff values for decision alternatives : there are 5 states of nature and the profit values for the first decision alternative are 6, 7, 4, 9, 8. The decision maker is pessimistic. Which payoff value is taken from the first decision alternative?
Seçenekler
A
4
B
6
C
7
D
8
E
9
Açıklama:
x = min = 4. If the payoff table is based on profits, first for each decision alternative, the minimum payoff value of each decision alternative is listed then among these payoff values the decision alternative producing the maximum is chosen as the best decision alternative. pg 190. Correct answer is A.
Soru 44
The payoff values for decision alternatives : there are 5 states of nature and the cost values for the first decision alternative are 0.8, 0.9, 0.2, 0.7, 0.6. The decision maker is pessimistic. Which payoff value is taken from the first decision alternative?
Seçenekler
A
0.2
B
0.6
C
0.7
D
0.8
E
0.9
Açıklama:
x = max = 0.9 . If the payoff table is based on costs, first for each decision alternative, the maximum payoff value of each decision alternative is listed then among these payoff values the decision alternative producing the minimum is chosen as the best decision alternative. pg 190. Correct answer is E.
Soru 45
The payoff values for decision alternatives : there are 5 states of nature and minimum payoff values for 5 decision alternatives are I) 1.150, II) 1.025, III) 1.275, IV) 1.725, V) 1.450. The decision maker is pessimistic. Which decision alternative is choosen?
Seçenekler
A
I
B
II
C
III
D
IV
E
V
Açıklama:
x = max = IV : 1.725 . pg 190. Correct answer is D.
Soru 46
The payoff values for decision alternatives : there are 5 states of nature and maximum payoff values for 5 decision alternatives are I) 0.15, II) 0.11, III) 0.72, IV) 0.27, V) 0.34. The decision maker is pessimistic. Which decision alternative is choosen?
Seçenekler
A
I
B
II
C
III
D
IV
E
V
Açıklama:
x = min = II : 0.11 . pg 190. Correct answer is B.
Soru 47
Decision maker defines the coefficient of optimism as 0.2 , then what is the coefficient of pessimism?
Seçenekler
A
0.04
B
0.10
C
0.20
D
0.40
E
0.80
Açıklama:
x = 1 - 0.2 = 0.8 . pg 194. Correct answer is E.
Soru 48
The payoff values for decision alternatives : there are 5 states of nature and the cost value for the first decision alternative is 5 according to optimist and 6 according to pessimist. If coefficient of oprimism is 0.4, what is payoff value for the first decision alternative?
Seçenekler
A
5.20
B
5.40
C
5.60
D
5.75
E
5.80
Açıklama:
x = 5 . 0.4 + 6 . (1 - 0.4) = 2 + 3.6 = 5.6 . pg 194. Correct answer is C.
Soru 49
The payoff values for decision alternatives : there are 5 states of nature and the cost value for the first decision alternative is 6 according to optimist and 5 according to pessimist. If coefficient of oprimism is 0.2, what is payoff value for the first decision alternative?
Seçenekler
A
5.75
B
5.60
C
5.45
D
5.20
E
5.15
Açıklama:
x = 6 . 0.2 + 5 (1 - 0.2) = 1.2 + 4 = 5.2 . pg. 194 . Correct answer is D.
Soru 50
A decision alternative has 80 and 30 as payoff values and the probabilities of the associated states of nature are 0.60 and 0.40 respectively. What is the expected monetary value of this decision alternative?
Seçenekler
A
63
B
60
C
57
D
50
E
43
Açıklama:
x = 80 . 0.6 + 30 . 04 = 48 + 12 = 60 . pg. 197 . Correct answer is B.
Soru 51
In decision making, _____________ are the outcomes on which the decision maker has little or no control.
Seçenekler
A
probability
B
data
C
payoff matrix
D
states of nature
E
payoff
Açıklama:
In decision making, states of nature are the outcomes on which the decision maker has little or no control.
Soru 52
In decision making, for each combination of decision alternative and state of nature, a ____________ value is calculated?
Seçenekler
A
probability
B
mean
C
mode
D
alternative
E
payoff
Açıklama:
For each combination of decision alternative and state of nature, a payoff value is calculated.
Soru 53
In decision making, at least how many decision alternatives are necessary?
Seçenekler
A
1
B
2
C
3
D
4
E
5
Açıklama:
Once the problem is clearly defined, the next logical step is to investigate about the alternatives to solve the decision problem. We should find all the possible alternatives for the solution of the decision problem.
Soru 54
In decision making, where do we show all the possible decision alternatives of the problem, all the states of nature and the payoff values for each of alternative and states of nature combination?
Seçenekler
A
ANOVA table
B
t table
C
Identitiy matrix
D
Payoff matrix
E
Mode and median
Açıklama:
Once all the payoff values are calculated, a payoff matrix or decision table is created. The payoff matrix will show you all the possible decision alternatives of the problem, all the states of nature and the payoff values for each of alternative and states of nature combination.
Soru 55
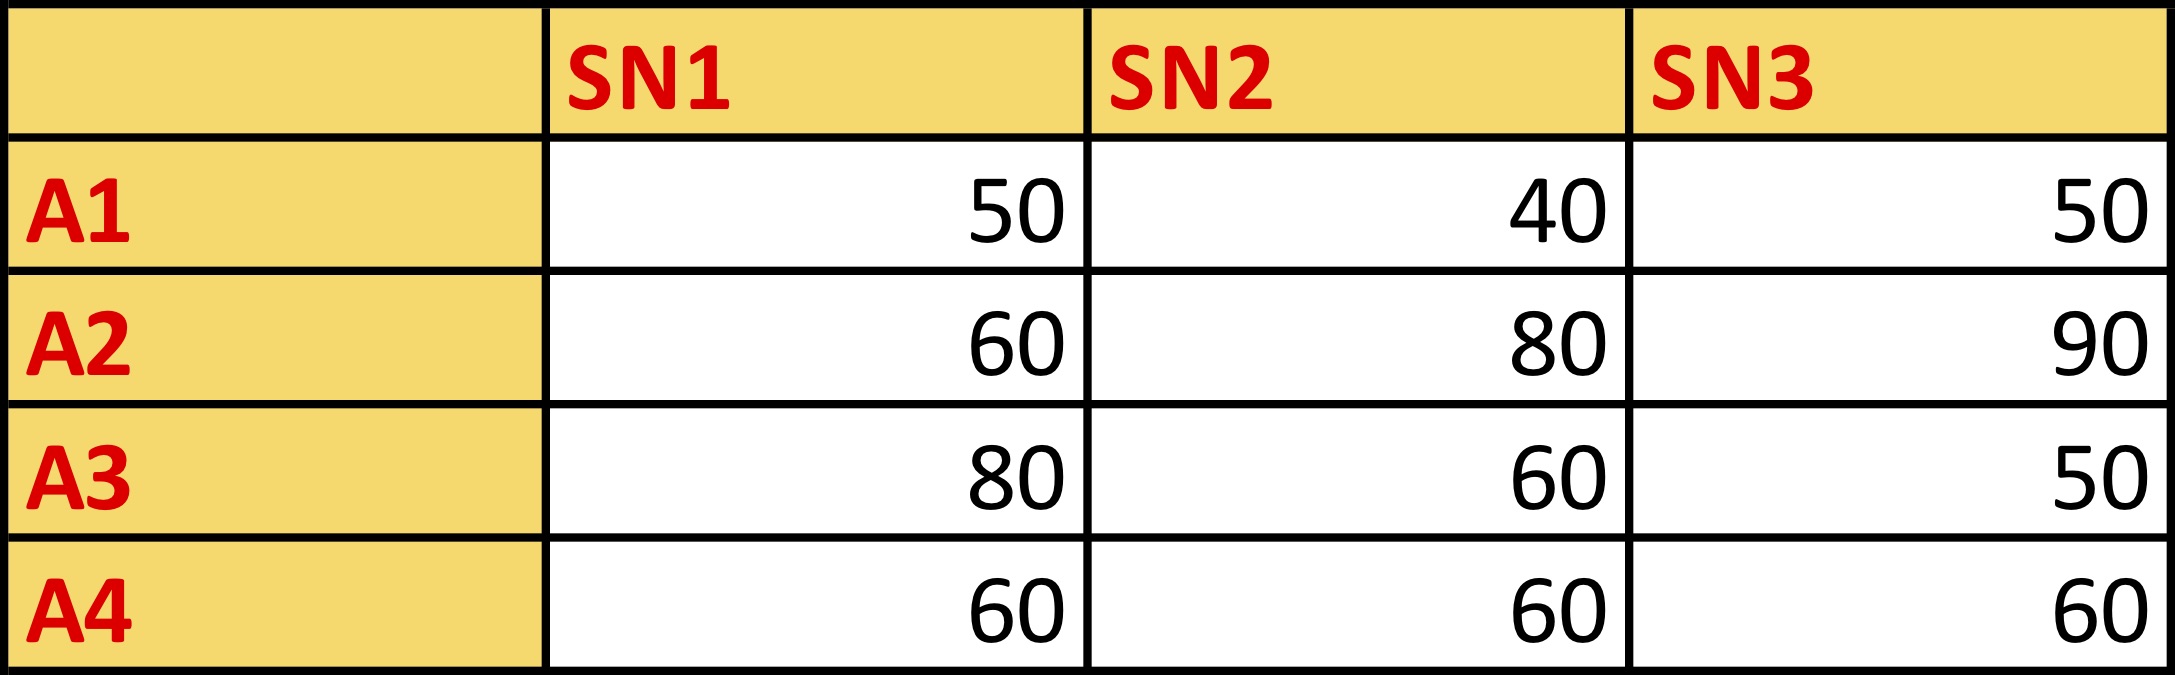 What is the value of maximax criterion for this profit based payoff matrix?
Seçenekler
A
60
B
70
C
80
D
90
E
100
Açıklama:
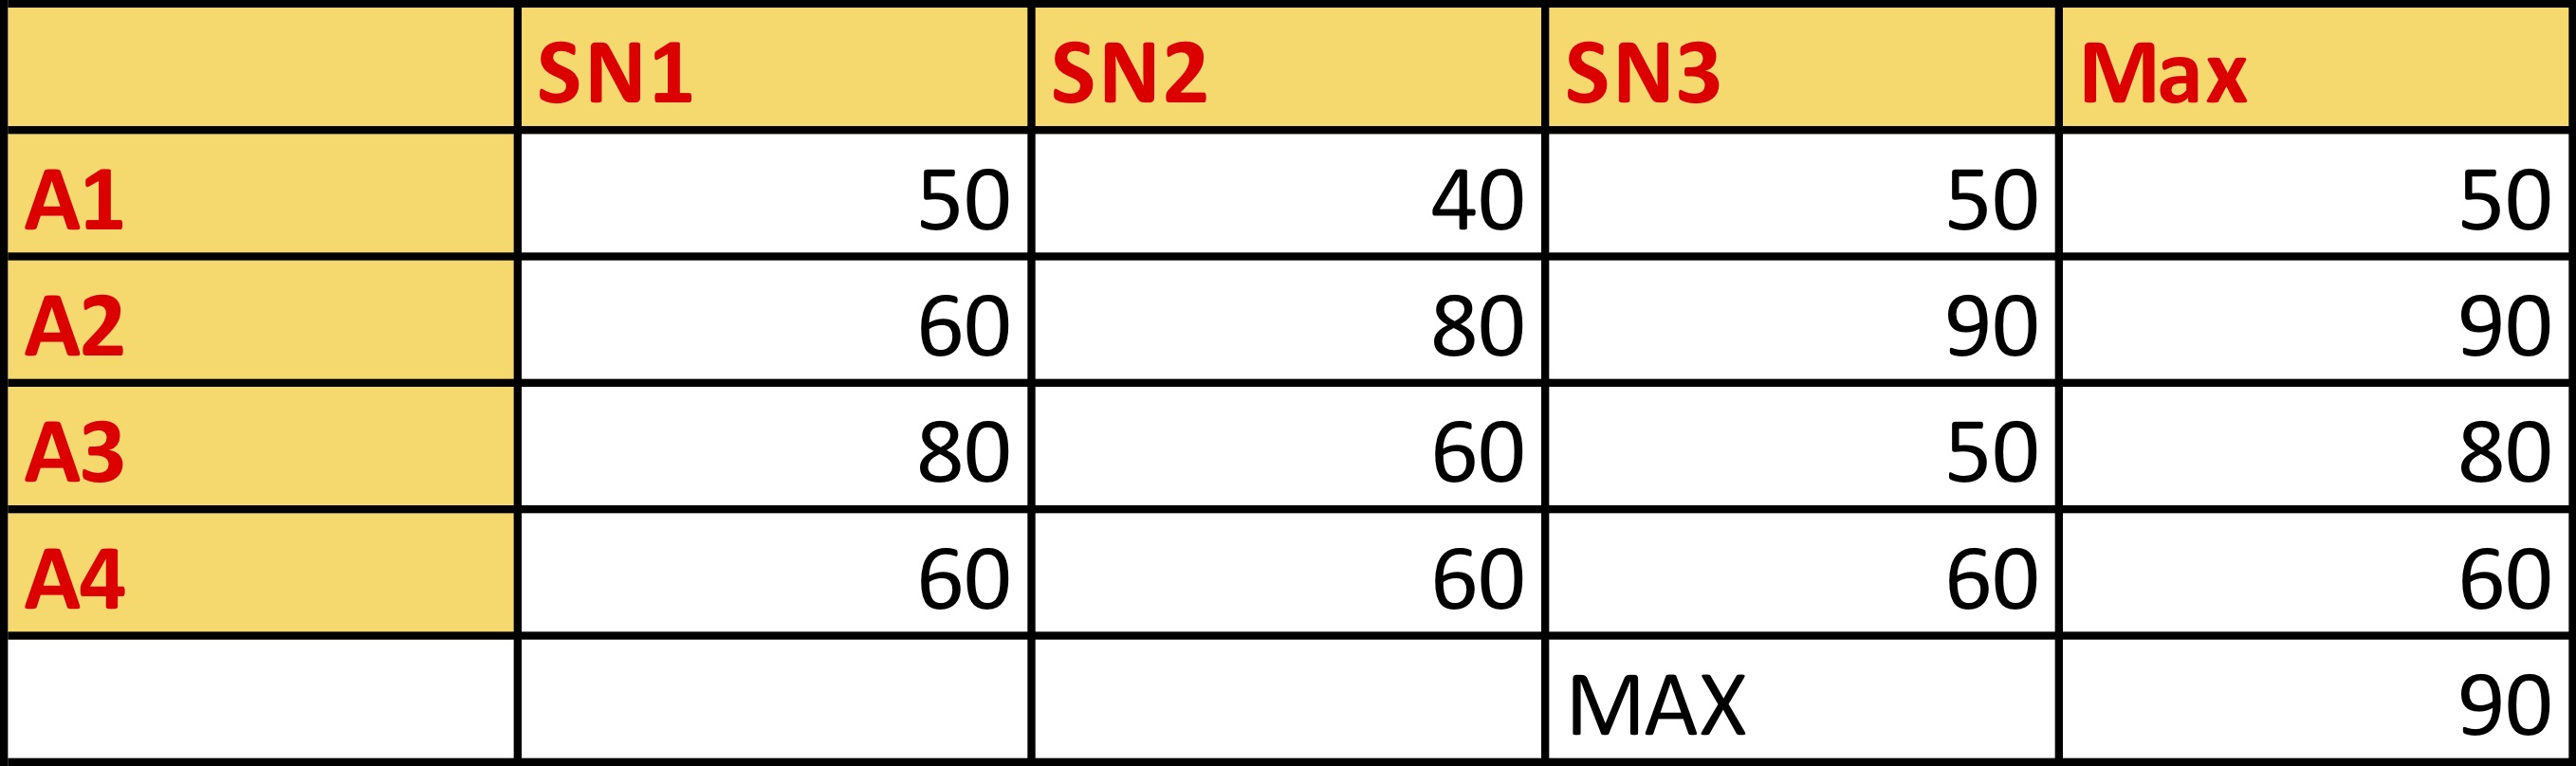
Soru 56
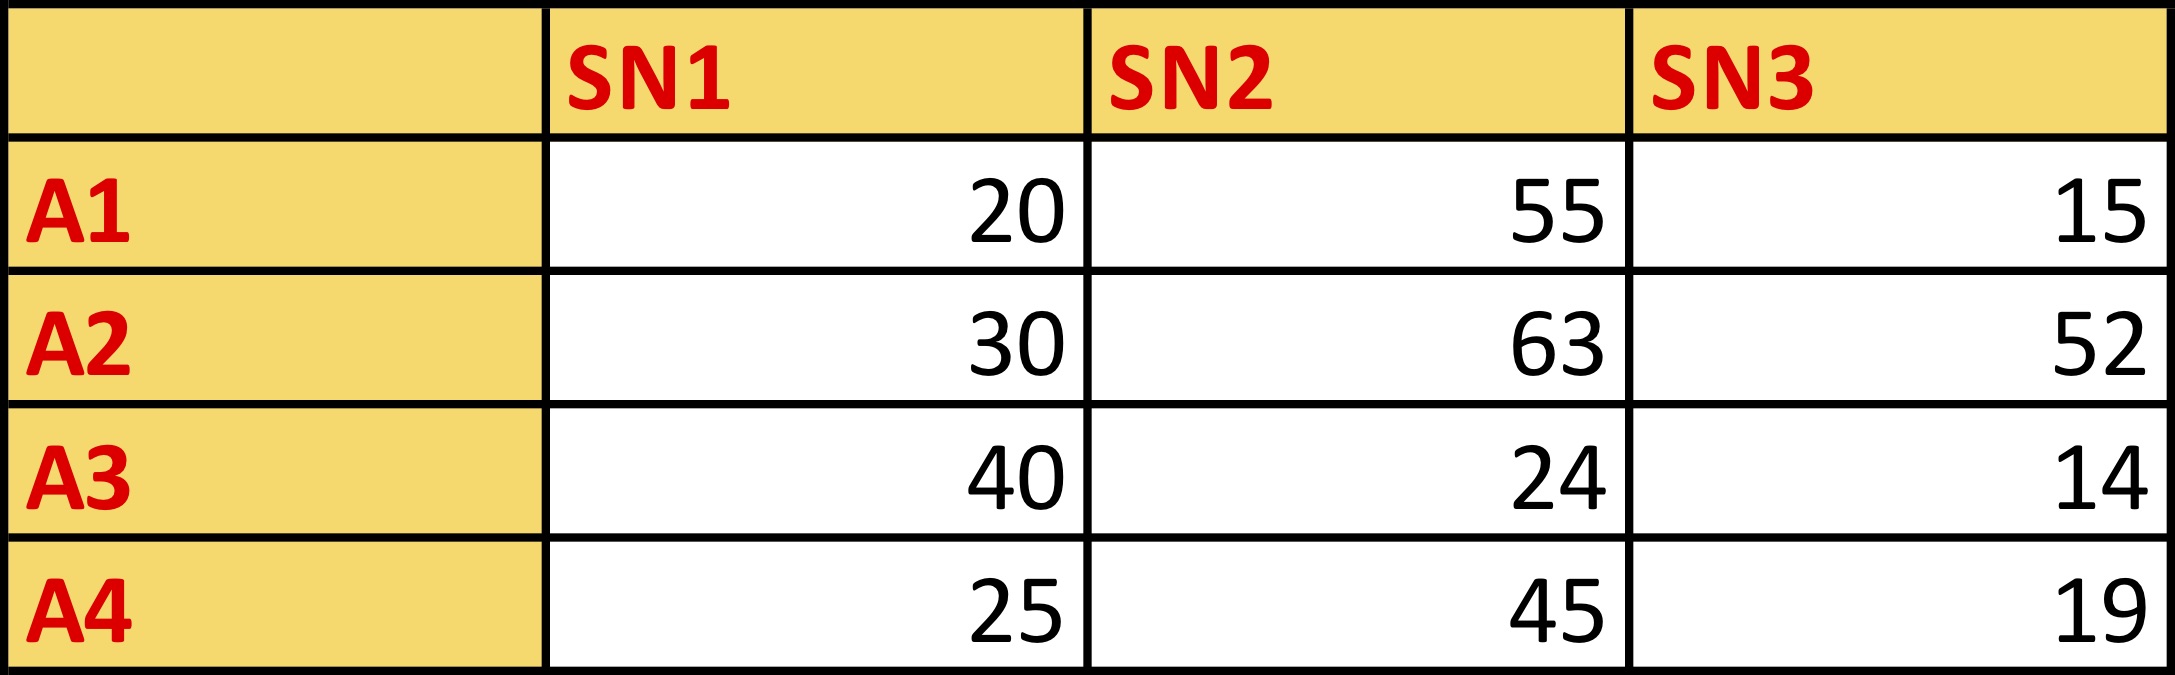 What is the value of minimin criterion for this profit based payoff matrix?
Seçenekler
A
14
B
15
C
25
D
26
E
32
Açıklama:
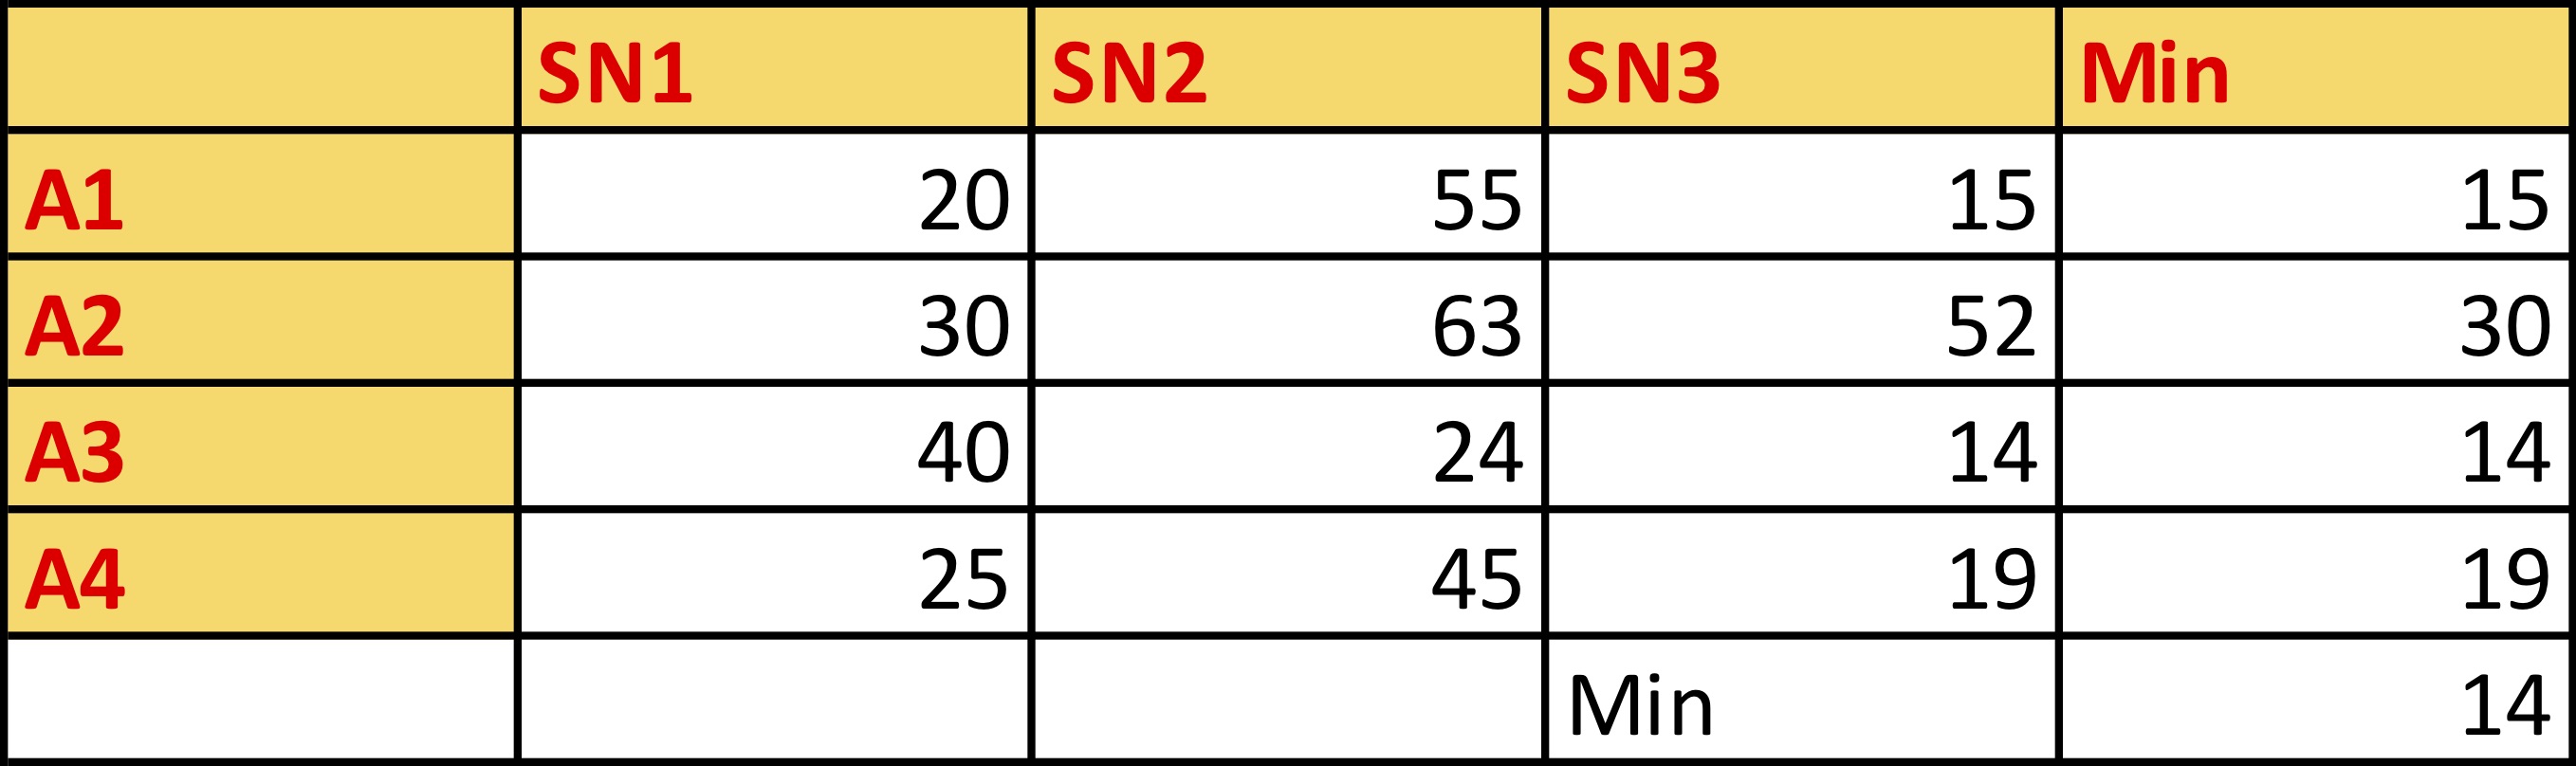
Soru 57
In which decision making criterion The decision maker tries to minimize the damage since the overall approach is to look for the best among the worst payoff values?
Seçenekler
A
maximax
B
minimin
C
Maximin
D
Max
E
probabilistic
Açıklama:
This method is also known as Wald’s pessimism criterion. In here, the decision maker follows a pessimistic approach to solve the decision problem. The decision maker tries to minimize the damage since the overall approach is to look for the best among the worst payoff values. Decision maker creates the payoff table table either profit or cost based for each combination of (decision alternative, state of nature). Then, the decision maker chooses the minimum or maximum payoff value for each decision alternative, and then decision maker selects the decision alternative that gives the lowest or highest of these payoffs.
Soru 58
In Hurwicz criterion, if the value of coefficient of optimism is equal to 1, what is the state of the mind of decision maker?
Seçenekler
A
Pessimistic
B
Realistic
C
Doubtful
D
Optimistic
E
Cost effective
Açıklama:
In a paper in 1951, Leonard Hurwicz suggested a new method that balances the optimism and pessimism of the decision maker. In this method, the decision maker is allowed to have best and worst possible outcomes considered. In order to achieve this, Hurwicz suggests the use of coefficient of optimism. It is symbolized with α and it is a decimal number between 0 and 1. If α = 1, then the decision maker is hundred percent optimistic. If α = 0, then the decision maker is hundred percent pessimistic. Since α is the level of optimism we may easily call 1 - α as the level of pessimism in the decision problem. Therefore, by changing the value of the α, the decision maker may try to balance the optimism and pessimism.
Soru 59
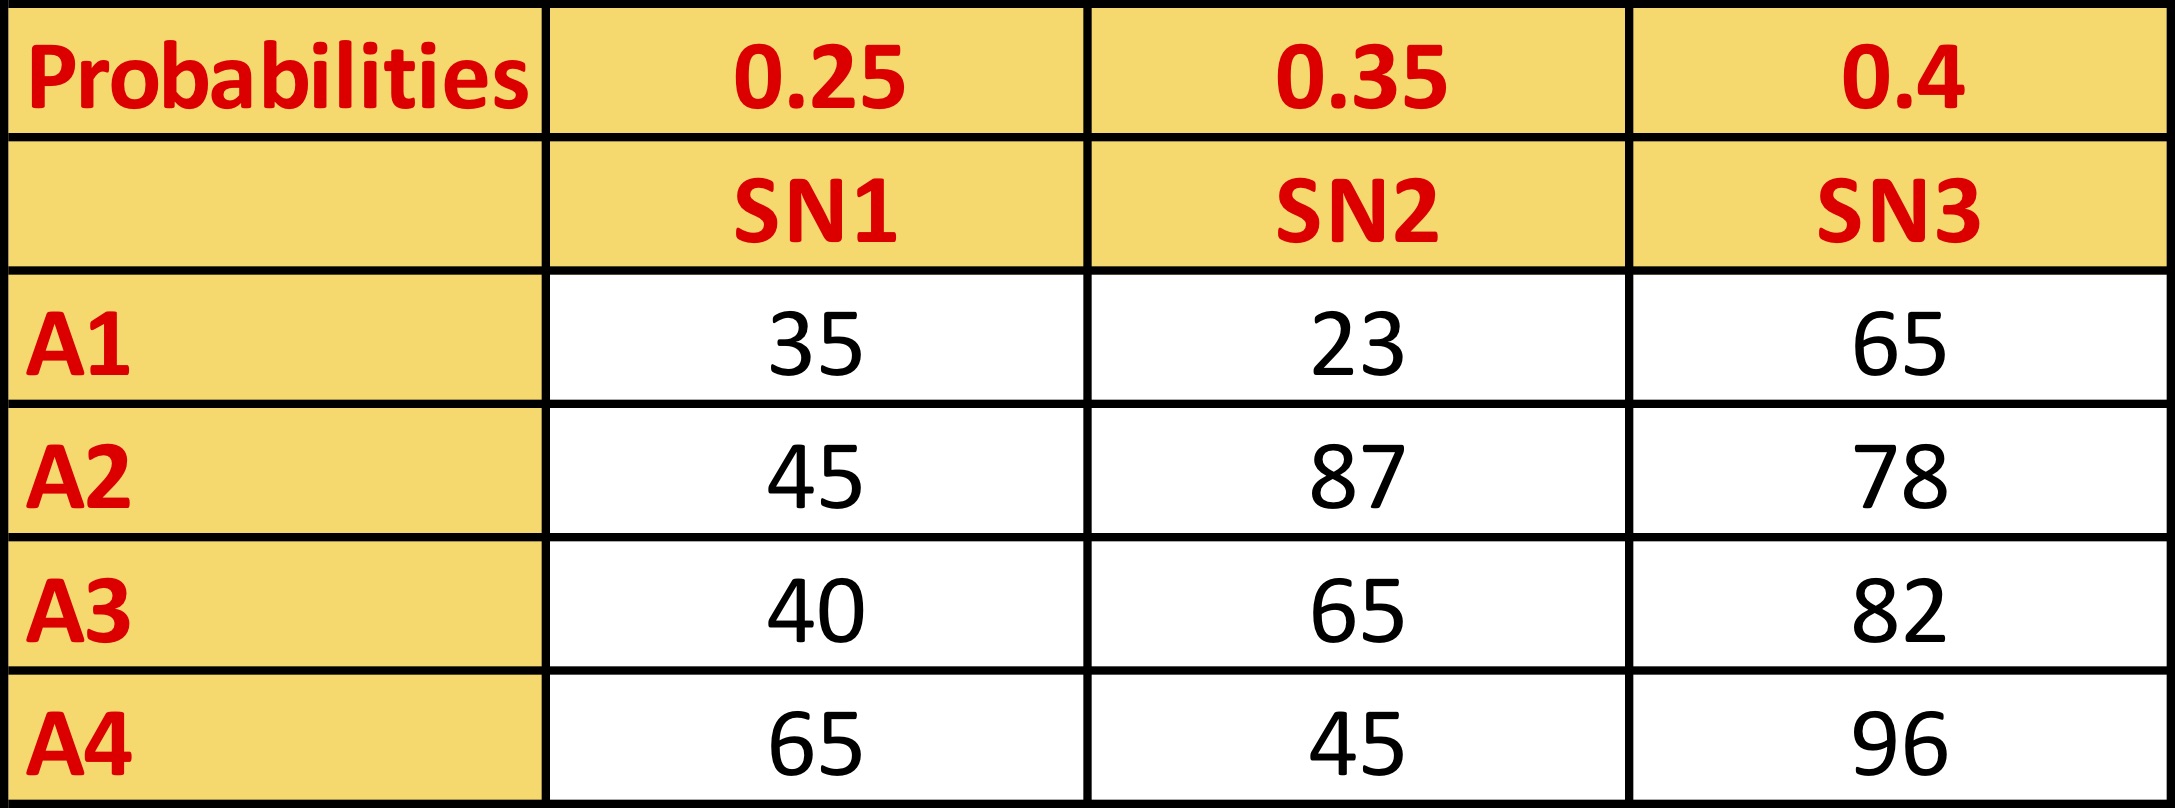 What is the expected monetary value of this profit based payoff matrix?
Seçenekler
A
200.45
B
225.70
C
251.65
D
300.25
E
350.45
Açıklama:
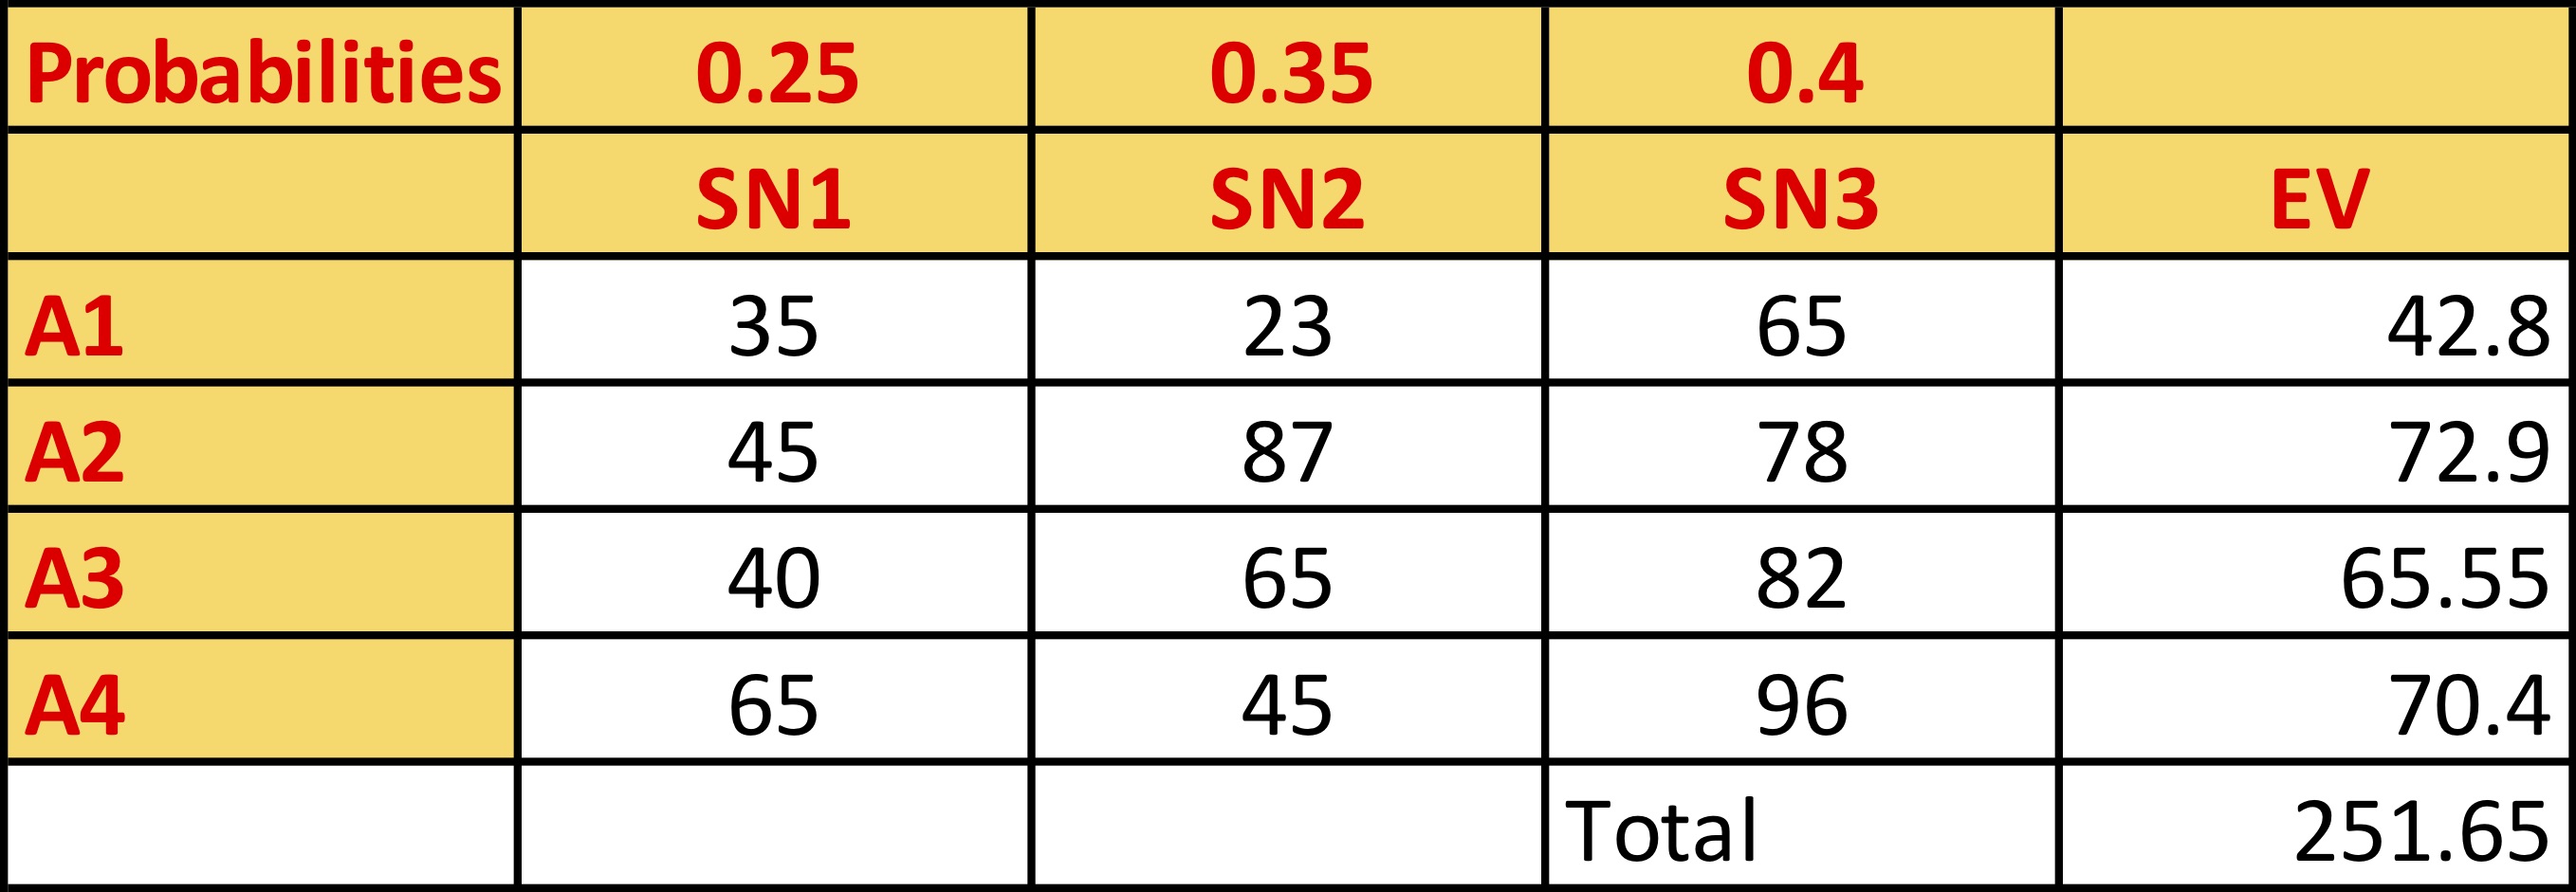
Soru 60
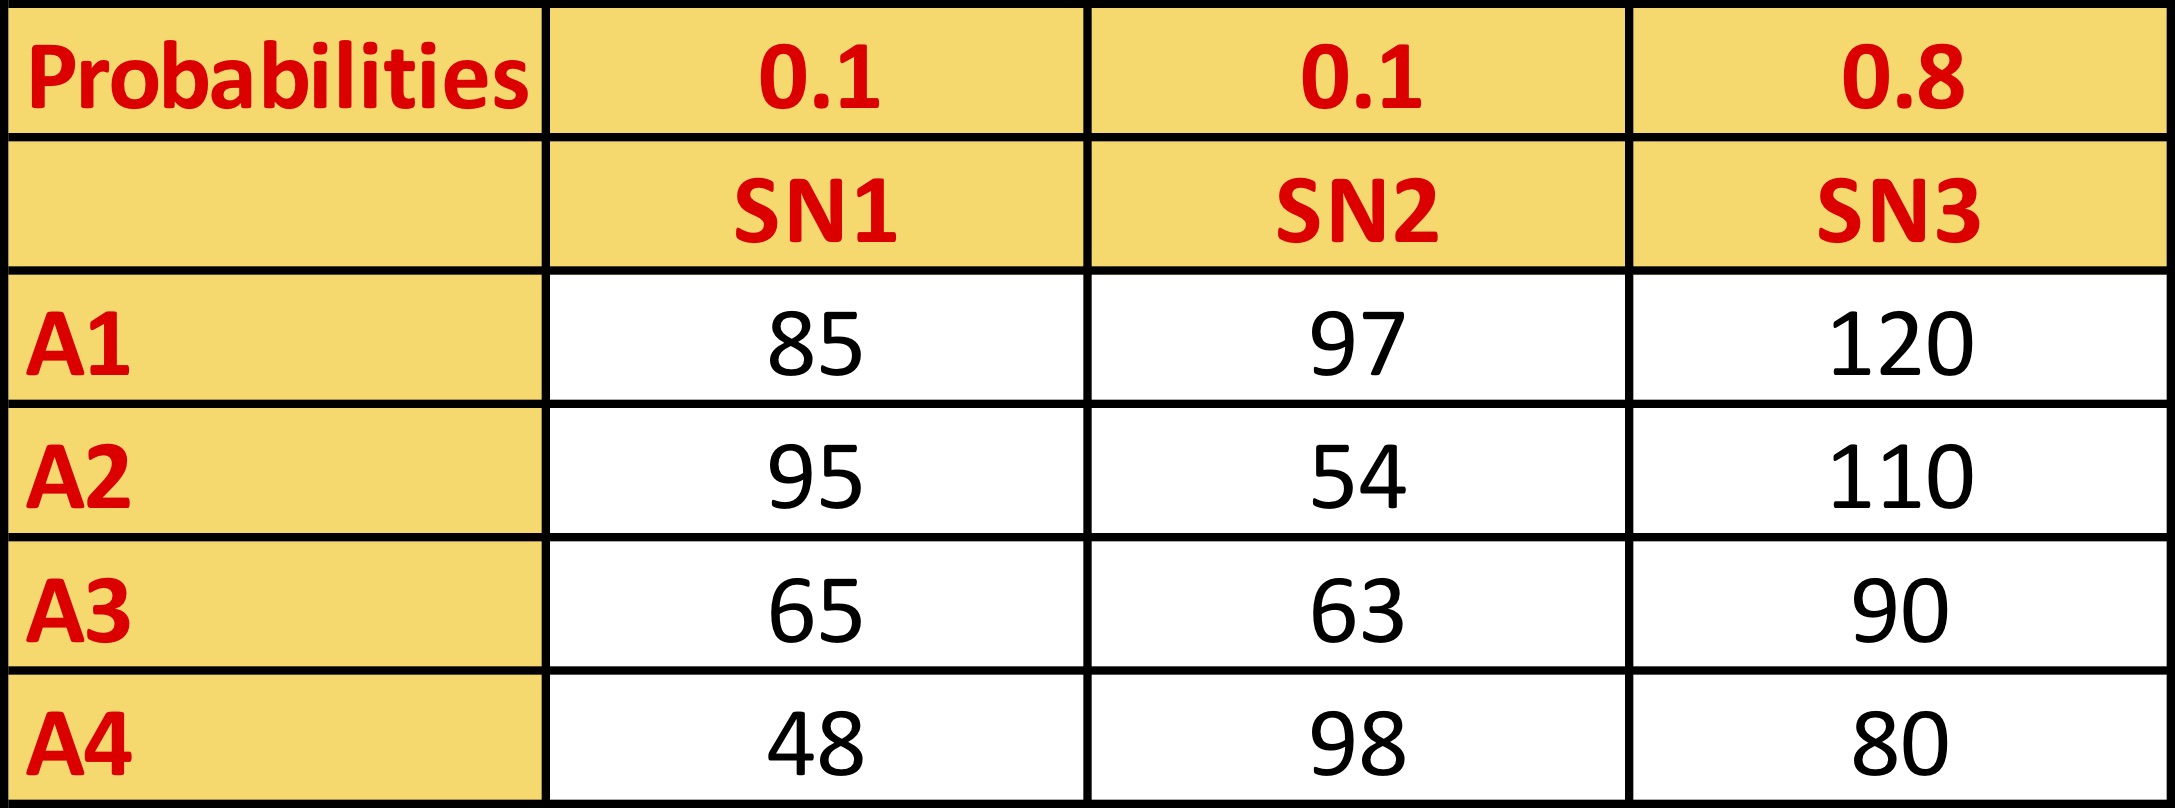 What is the expected monetary value of the decision alternative A3?
Seçenekler
A
65.12
B
78.6
C
102.9
D
114.2
E
84.80
Açıklama: