Statıstıcs I (ENG) - Tüm Sorular
Ünite 1
Soru 1
The size of a ......I..... is always less than the size of the ......II....... from which it is taken.
Which of the following terms correctly completes the sentence above?
Which of the following terms correctly completes the sentence above?
Seçenekler
A
I- interval
II- Data
II- Data
B
I-Data
II-Nominal
II-Nominal
C
I-Ordinal
II-Population
II-Population
D
I-Ratio
II-Interval
II-Interval
E
I-Sample
II-Population
II-Population
Açıklama:
A population contains all members of a specified group Example: The population may be "ALL people living in the Turkey"
A sample data set contains a part, or a subset, of a population. The size of a sample is always less than the size of the population from which it is taken. Example: The sample may be "SOME people living in the Turkey"
A sample data set contains a part, or a subset, of a population. The size of a sample is always less than the size of the population from which it is taken. Example: The sample may be "SOME people living in the Turkey"
Soru 2
I- Students' GPAs
II-Political parties
III- Educational level
What type of variable are the ones described above?
II-Political parties
III- Educational level
What type of variable are the ones described above?
Seçenekler
A
I-Interval
II-Nominal
III-Ordinal
II-Nominal
III-Ordinal
B
I-Ratio
II-Nominal
III-Interval
II-Nominal
III-Interval
C
I-Nominal
II-Interval
III-Ordinal
II-Interval
III-Ordinal
D
I-Interval
II-Ratio
III-Ratio
II-Ratio
III-Ratio
E
I-Ordinal
II-Nominal
III-Interval
II-Nominal
III-Interval
Açıklama:
Nominal scale is a scale of measurement that is used for identification purposes. A nominal scale describes a variable with categories that do not have a natural order or ranking.
Ordinal Scale involves the ranking or ordering of the attributes depending on the variable being scaled.
Interval scale of data measurement is a scale in which the levels are ordered and each numerically equal distances on the scale have equal interval difference, but no absolute zero.
Ratio scale has all the properties of an interval variable, and also has a clear definition of zero. When the variable equals zero, there is none of that variable.
Soru 3
The variables are measured using an .............. scale, which not only shows the order but also shows the exact difference in the value.
Which type of scale should replace the blank space in the above sentence?
Which type of scale should replace the blank space in the above sentence?
Seçenekler
A
Ordinal
B
Categorical
C
Nominal
D
Interval
E
Ratio
Açıklama:
Unlike ordinal variables that take values with no standardized scale, every point in the interval scale is equidistant. Arithmetic operations can also be performed on the numerical values of the interval variable.
The interval scale of data measurement is a scale in which the levels are ordered and each numerically equal distances on the scale have equal interval difference.
The interval scale of data measurement is a scale in which the levels are ordered and each numerically equal distances on the scale have equal interval difference.
Soru 4
150 college students were randomly assigned to played either a violent or nonviolent video game. A short time later, the students who played the violent video game punished an opponent (received a noise blast with varying intensity) for a longer period of time than did students who had played the nonviolent video game.
What type of study is described above?
What type of study is described above?
Seçenekler
A
Experimental
B
Correlational
C
Survey
D
Observational
E
Qualitative
Açıklama:
Observational study - data are observed and collected on each subject and no manipulation of the subjects’ environment occurs.
Experimental study- Manipulate the subjects’ environment, then measure the response variable.
Experimental study- Manipulate the subjects’ environment, then measure the response variable.
Soru 5
.................... is the combination of statistics, mathematics, programming, problem-solving, capturing data in ingenious ways, the ability to look at things differently, and the activity of cleansing, preparing, and aligning the data.
What is the correct concept for the sentence above?
What is the correct concept for the sentence above?
Seçenekler
A
Big data
B
Statistics
C
Data science
D
Population
E
Sample
Açıklama:
Dealing with unstructured and structured data, Data Science is a field that comprises everything that related to data cleansing, preparation, and analysis. Data science is the combination of statistics, mathematics, programming, problem-solving, capturing data in ingenious ways, the ability to look at things differently, and the activity of cleansing, preparing, and aligning the data. In simple terms, it is the umbrella of techniques used when trying to extract insights and information from data.
Soru 6
- Statisticians are the most sought-after professionals these days.
- The Statistician's mission is handling, analysing, interpreting and facilitating decisions from data.
- The principal reason why Statistics is a key necessity to humankind today is the massive amounts of available information.
Seçenekler
A
I, II, III
B
I and II
C
II and III
D
I and III
E
I
Açıklama:
Statisticians are the most sought-after professionals these days.We are living in the information age, and the Statistician is the king of handling, analysing, interpreting and facilitating decisions from data. The principal reason why Statistics is a key necessity to humankind today is the massive amounts of available information.
Soru 7
The main criteria for selecting a sample will be that the sample is _____I_____ of the population and that there’s no or very little ____II_____ in the choice of the sampling units.
Which of the following options fills the blank in the above sentence in the most correct way?
Which of the following options fills the blank in the above sentence in the most correct way?
Seçenekler
A
I - representative II - subjectivity
B
I - representative II - objectivity
C
I - inclusive II - subjectivity
D
I - inclusive II - objectivity
E
I - containing II - objectivity
Açıklama:
The main criteria for selecting a sample will be that the sample is representative of the population and that there’s no or very little subjectivity in the choice of the sampling units.
Soru 8
Which of the following is not a nominal variable?
Seçenekler
A
Exam grade
B
Gender
C
Region of residence
D
Field of study
E
Type of transport
Açıklama:
The easiest form of data is called categorical, or qualitative. Categorical variables and data can be either nominal or ordinal. Exam grade is an ordinal categorical variable, since its categories are ordered: A is better than a B, B is better than a C, and so on. Other examples of nominal categorical variables are gender, region of residence, field of study, type of transport, type of housing, etc.
Soru 9
Which of the following is not an ordinal variable?
Seçenekler
A
Type of housing
B
Income group
C
Exam grade
D
Educational level
E
An attitude question in a survey where possible responses are agree / disagree.
Açıklama:
Categorical variables and data can be either nominal or ordinal. Examples of nominal categorical variables are gender, region of residence, field of study, type of transport, type of housing, etc. There is no ordering in the categories of these variables. . Exam grade is an ordinal categorical variable, since its categories are ordered: A is better than a B, B is better than a C, and so on. Other examples of ordinal categorical variables are income group (If incomes have been categorized), an attitude question in a survey where possible responses are strongly agree/agree/disagree/strongly disagree (these categories have an order).
Soru 10
Age is a _______ scale data. Which of the following options fills the blank in the above sentence in the most correct way?
Seçenekler
A
Ratio
B
Interval
C
Nominal
D
Ordinal
E
Qualitative
Açıklama:
The other main type of data is called continuous, or quantitative, for example data on variables “blood pressure”, “age” and “income”. These are observations of variables on continuous scales, usually rounded in some convenient way. For example, although age is a continuous time variable, and we are getting older all the time by seconds, minutes and hours, someone’s age is almost always rounded to the number of years completed. There is a subtle difference between interval-scale and ratio-scale continuous data, which is worth mentioning here. Age is an interval-scale variable: to compare two children of ages 10 and 12, we would compute the interval difference, .e. 2 years.
Soru 11
As a general rule, most data on monetary values and those coming from physical measurements (e.g., lira, gold price, centimeters, kilograms) are _____ variables.
Which of the following options fills the blank in the above sentence in the most correct way?
Which of the following options fills the blank in the above sentence in the most correct way?
Seçenekler
A
Interval-scale
B
Nominal-scale
C
Ratio-scale
D
Ordinal-scale
E
Categorical-scale
Açıklama:
As a general rule, most data on monetary values and those coming from physical measurements (e.g., lira, gold price, centimeters, and kilograms) are ratio-scale variables.
Soru 12
- Commerce, especially online electronic commerce
- Finance, for example share prices on stock markets, all managed electronically
- Insurance, all the premiums, incidents, actuarial transactions in an insurance company
- Transport, for example in the airline industry, all the flights, all the passengers
Seçenekler
A
I, II and III
B
I, III and IV
C
I, II and IV
D
II, III and IV
E
I, II, III and IV
Açıklama:
What are the “big data” sets today and where do they come from? These are mostly found in the following areas:
- Commerce, especially online electronic commerce
- Finance, for example share prices on stock markets, all managed electronically
- Insurance, all the premiums, incidents, actuarial transactions in an insurance company
- Biomedicine, especially in genetics, where information is literally exploding as gene-sequencing reveals and codes the total genetic profile of a person
- Transport, for example in the airline industry, all the flights, all the passengers
- Climate data, measurements from tens of thousands of weather stations across the world
Soru 13
Inflation rate, which compares the prices of a basket of products over time, is a _______ variable.
Which of the following correctly fills the blank above?
Which of the following correctly fills the blank above?
Seçenekler
A
Interval-scale
B
Nominal-scale
C
Ratio-scale
D
Ordinal-scale
E
Categorical-scale
Açıklama:
As a general rule, most data on monetary values and those coming from physical measurements (e.g., lira, gold price, centimeters, and kilograms) are ratio-scale variables.
Soru 14
- The first role of Statistics is to reduce this mass of complex data to a simpler form in order to facilitate understanding and learning from the data.
- Words, SMSs, tweets, social media posts, verbal responses in questionnaires, these can all be treated as data.
- Climate data, measurements from tens of thousands of weather stations across the world, is an example of big data.
Seçenekler
A
I, II and III
B
I and II
C
II and III
D
I and III
E
III
Açıklama:
The first role of Statistics is to reduce this mass of complex data to a simpler form in order to facilitate understanding and learning from the data. This is often done by making graphical representations of the data. Statistics can make a lot of numerical data easily understandable. The world today abounds in textual data. Words, SMSs, tweets, social media posts, verbal responses in questionnaires, these can all be treated as data. Climate data, measurements from tens of thousands of weather stations across the world, is an example of big data.
Soru 15
Which of the following variable is an example of interval scale?
Seçenekler
A
Hours of sleep
B
Inflation rate
C
Income group
D
Exam grade
E
Educational level
Açıklama:
The other main type of data is called continuous, or quantitative, for example data on variables “blood pressure”, “age” and “income”. These are observations of variables on continuous scales, usually rounded in some convenient way. For example, although age is a continuous time variable, and we are getting older all the time by seconds, minutes and hours, someone’s age is almost always rounded to the number of years completed. There is a subtle difference between interval-scale and ratio-scale continuous data, which is worth mentioning here. Other measures of time are interval-scale variables, for example hours of sleep (on Sundays I sleep an hour longer - I would not say I sleep 14% longer).
Soru 16
Which of the following are not done by using statistics?
Seçenekler
A
analyse website traffic
B
decide if medical treatments are effective
C
analyse the examination grades
D
check the financial transactions of a sports club
E
interpret visitors’ data
Açıklama:
check the financial transactions of a sports club
Soru 17
Which of the following is not variable?
Seçenekler
A
price
B
blue
C
radio stations
D
color of hair
E
age of tooth
Açıklama:
Blue is data, not variable.
Soru 18
Which of the following is not data?
Seçenekler
A
face photo
B
100 kg
C
50 %
D
Eskişehir
E
address
Açıklama:
Address is variable, not data.
Soru 19
What type of variable is your weight?
Seçenekler
A
qualitative nominal
B
qualitative ordinal
C
quantitative ratio
D
quantitative interval
E
continuous regular
Açıklama:
quantitative ratio
Soru 20
What type of variable is Aristotle’s logic’s truth which gets values true or false?
Seçenekler
A
qualitative ordinal
B
qualitative nominal
C
continuous regular
D
quantitative interval
E
quantitative ratio
Açıklama:
qualitative ordinal
Soru 21
Is your answer to this question data?
Seçenekler
A
No
B
Yes
C
Maybe
D
Sometime
E
It depends on time
Açıklama:
Yes
Soru 22
What type of variable is a girl’s answer to a marriage offer?
Seçenekler
A
continuous regular
B
quantitative interval
C
quantitative ratio
D
qualitative ordinal
E
qualitative nominal
Açıklama:
qualitative nominal
Soru 23
Which of the following do not constitute big data?
Seçenekler
A
Anadolu University’s website’s visitor traffic
B
internet browsing traffic in Anadolu University
C
Statistics course book
D
phone call traffic in Anadolu University
E
Anadolu University’s library’s user traffic
Açıklama:
Statistics course book
Soru 24
Which of the following is not variable?
Seçenekler
A
silence
B
altitude
C
sound
D
taste
E
smell
Açıklama:
silence is data, not variable
Soru 25
Which of the following is not data?
Seçenekler
A
Anadolu University
B
Statistics Department
C
Statistics course
D
Anadolu University students
E
Anadolu University campus
Açıklama:
Anadolu University students is variable, not data
Soru 26
What cannot be an example showing that statistics is part of our daily lives?
Seçenekler
A
changing climate records
B
making weather forecast
C
understanding climate patterns
D
displaying weather forecasting
E
keeping wind direction records
Açıklama:
Statistics is at the heart of understanding climate patterns and making weather forecasts. The first role of Statistics is to reduce this mass of complex data to a simpler form in order to facilitate understanding and learning from the data. This is often done by making graphical representations of the data.
Soru 27
Which of the statements below CANNOT be true about Statistics?
Seçenekler
A
Statistics can make a lot of numerical data easily understandable.
B
We often talk of estimates in Statistics.
C
Most of the observations can be reduced to some numerical quantity through statistical methods.
D
We cannot get access to every single data on the topic that we are interested in.
E
Statistics usually samples from a very small data, not from a large population.
Açıklama:
It may seem that everything may be recorded and stored somewhere. But in reality - unless we somehow centralize and link all the databases in the world, and have free access to them - we can get access to only a small part of whatever data we are interested in. For example, it is impossible to ask the whole population of Turkey what their view on climate change is, whether they believe it is natural or manmade. This is where the most basic concept in Statistics comes into play: sampling from a population.
Soru 28
What type of variable are your exam grades such as A, B?
Seçenekler
A
interval-scale variable
B
nominal categorical variable
C
ordinal categorical variable
D
ratio-scale variable
E
continous interval variable
Açıklama:
Categorical variables and data can be either nominal or ordinal.
The question about climate change, with possible responses “natural”, “manmade” or “don’t know/can’t answer” is a nominal categorical variable, as is the variable “country” - there is no ordering in the categories of these variables. By contrast, exam grade is an ordinal categorical variable, since its categories are ordered: A is better than a B, B is better than a C, and so on.
The question about climate change, with possible responses “natural”, “manmade” or “don’t know/can’t answer” is a nominal categorical variable, as is the variable “country” - there is no ordering in the categories of these variables. By contrast, exam grade is an ordinal categorical variable, since its categories are ordered: A is better than a B, B is better than a C, and so on.
Soru 29
"Comparing the prices of a basket of products over time" is an example of .....?
Seçenekler
A
interval-scale variable
B
ratio-scale variable
C
nominal categorical variable
D
ordinal categorical variable
E
qualitative variable
Açıklama:
There is a subtle difference between interval-scale and ratio-scale continuous data, which is worth mentioning here. Age is an interval-scale variable: to compare two children of ages 10 and 12, we would compute the interval difference, i.e. 2 years. We would not say the 12-year old is 20% older than the 10-year old. But comparing prices or incomes, for example, we would tend to compute percentage differences, making them ratio-scale variables. A good example is the inflation rate, comparing the prices of a basket of products over time, not as a difference but as a percentage. As a general rule, most data on monetary values and those coming from physical measurements (e.g., lira, gold price, centimeters, kilograms) are ratio-scale variables.
Soru 30
"Twitter is an American microblogging and social networking service on which users post and interact with messages known as tweets" (https://en.wikipedia.org)
What type of data are tweets you write on Twitter?
What type of data are tweets you write on Twitter?
Seçenekler
A
textual data
B
verbal data
C
ordinal data
D
scale data
E
interval data
Açıklama:
The world today abounds in textual data. Words, SMSs, tweets, social media posts, verbal responses in questionnaires, these can all be treated as data. Some recoding will be necessary, since text is not numerical. Frequently occurring words can be counted, the lengths of sentences can be measured, the number of words used just once can be identified, and so on, in order to create quantitative variables from text. Textual data have been used, for example, in identifying the author of threatening letters, in comparing political party manifestos, in classifying respondents in a survey who give answers to open ended questions.
Soru 31
What is Biostatistics ?
Seçenekler
A
Statistics in Biology research
B
Statistics in Medical research
C
Statistics in Biometry research
D
Statistics in Biochemistry research
E
Statistics in Social research
Açıklama:
Medical research is a good context to understand these differences - Statistics in medical research is often called Biostatistics.
Soru 32
In a research investigating the effects of playing online games on aggressive behavior, 100 teenagers are observed. What statistical term represents these 100 teenagers in this particular experiment?
Seçenekler
A
population
B
data
C
sample
D
variable
E
scale
Açıklama:
The way the sample is collected is crucial to obtaining a valid estimate, and this is an important subject which will be dealt with in this course. The main criteria for selecting a sample will be that the sample is representative of the population and that there is no or very little subjectivity in the choice of the sampling units. Sampling is not only conducted by survey researchers on human populations, but also by auditors on a company’s accounts, by agricultural researchers on different pieces of land, and by quality control inspectors on products in a factory, to name only a few examples.
Soru 33
In a research investigating the effects of playing online games on aggressive behavior, 40 teenagers at the age of 10 plays 4 hours of violence games and 40 teenagers at the age of 10 does not play any video games. What type of research is this research?
Seçenekler
A
observation
B
statistical
C
case
D
experimental
E
single-case
Açıklama:
In order to be able to prove that aspirin is the cause of the improvement in health, an experiment needs to be conducted where conditions are controlled between those taking aspirin and those not taking it. Such an experiment might be designed as follows, restricted to men, for example, since the effects are suspected to be different for men and women.
Soru 34
To prove that aspirin is the cause of the improvement in health, what type of research needs to be conducted?
Seçenekler
A
case
B
observation
C
statistical
D
experimental
E
report
Açıklama:
In order to be able to prove that aspirin is the cause of the improvement in health, an experiment needs to be conducted where conditions are controlled between those taking aspirin and those not taking it. Such an experiment might be designed as follows, restricted to men, for example, since the effects are suspected to be different for men and women.
Soru 35
Which one below is a term that has the same meaning the with the term Statistics?
Seçenekler
A
Data Science
B
Database Management
C
Data Visualization
D
Computer Science
E
Analytics
Açıklama:
At the start of this Introduction we asked “What is Statistics? What is Data Science? What is Analytics?” To deal with Analytics first, this is a term now used in business circles as a substitute for the word Statistics, but it really means the same thing. The word Statistics is considered by some people, especially businessmen, as a bit old-fashioned, and sometimes even difficult to pronounce! But don’t be fooled: Analytics is a fancy word for Statistics.
When it comes to Data Science, however, the term does have some different meaning. Data Science is a field that includes Statistics as well as areas such as Computer Science, Database Management and Data Visualization, for example, and has come into being mainly as a result of the spectacular growth in the amount of available data in this new information world that we live in.
When it comes to Data Science, however, the term does have some different meaning. Data Science is a field that includes Statistics as well as areas such as Computer Science, Database Management and Data Visualization, for example, and has come into being mainly as a result of the spectacular growth in the amount of available data in this new information world that we live in.
Soru 36
- The main criteria for selecting a sample will be that the sample is representative of the population and that there is no or very little subjectivity in the choice of the sampling units.
- Sampling is not only conducted by survey researchers on human populations, but also by auditors on a company’s accounts, by agricultural researchers on different pieces of land, and by quality control inspectors on products in a factory, to name only a few examples.
- Data come in the form of numbers as well as text.
- All observations can be reduced to some numerical quantity.
- The way the sample is collected is crucial to obtaining a valid estimate.
Which of the above are correct?
Seçenekler
A
I and II
B
I, II and III
C
III, IV and V
D
I, II, IV and V
E
I, II, III, IV and V
Açıklama:
Recommended Correction
Page 3
When 4 is added to 5, the result is exactly 9; when hyrdrogen and nitrogen are synthesized,…
When 4 is added to 5, the result is exactly 9; when hydrogen and nitrogen are synthesized,…
Data come in the form of numbers as well as text, which is something we are discovering more and more. We live in an information world and information is the virtual gold of our society. All observations can be reduced to some numerical quantity, and there are even fields of digital philosophy and digital sociology. (Page 6)
…The key to all of the above is the phrase: “a sample of about 1000 carefully selected people”. The way the sample is collected is crucial to obtaining a valid estimate, and this is an important subject which will be dealt with in this course. The main criteria for selecting a sample will be that the sample is representative of the population and that there is no or very little subjectivity in the choice of the sampling units. Sampling is not only conducted by survey researchers on human populations, but also by auditors on a company’s accounts, by agricultural researchers on different pieces of land, and by quality control inspectors on products in a factory, to name only a few examples. (Page 7)
As also understood from the information given, the correct answer isI, II, III, IV and V.
Soru 37
- Blood pressure
- A verbal response
- Number of supermarket visits
- Purchased products
- Course grade
Which of the above are statistical variables?
Seçenekler
A
I and V
B
I, II and III
C
II, IV and V
D
I, II, IV and V
E
I, II, III, IV and V
Açıklama:
Data come in various forms and are measured in different ways. For example, a doctor measures your blood pressure with an instrument, a survey researcher asks you a question and you give a verbal response, you go on holiday to a particular country, you are at a certain age and have a certain income, you have a grade for a completed university course, or this past week you have gone to the supermarket a certain number of times, and bought a certain basket of products, etc. Blood pressure, question response, country, age, income, course grade, number of supermarket visits and purchased products, these are all statistical variables.
As also understood from the information given, the correct answer is I, II, III, IV and V.
As also understood from the information given, the correct answer is I, II, III, IV and V.
Soru 38
- The observations made on the variables constitute the data.
- The subjects or individuals or companies on which these observations are made are called cases.
- Categorical variables and data can be either nominal or ordinal.
- Continuous variables and data can be either interval-scale or ratio-scale
Which of the above are correct?
Seçenekler
A
I and II
B
I and III
C
I, II and III
D
II, III and IV
E
I, II, III and IV
Açıklama:
The easiest form of data is called categorical, or qualitative, for example data on variables “country” (e.g., the data observation might be Germany) or “question response” (e.g., believe that climate change is manmade) or “exam grade” (e.g., B). Categorical variables and data can be either nominal or ordinal. The question about climate change, with possible responses “natural”, “manmade” or “don’t know/can’t answer” is a nominal categorical variable, as is the variable “country” - there is no ordering in the categories of these variables. By contrast, exam grade is an ordinal categorical variable, since its categories are ordered: A is better than a B, B is better than a C, and so on.
Other examples of nominal categorical variables are gender, region of residence, field of study, type of transport, type of housing, etc.
Other examples of ordinal categorical variables are income group (if incomes have been categorized), an attitude question in a survey where possible responses are strongly agree/agree/disagree/strongly disagree (these categories have an order), social class (with classes usually in an inherent order), terrorist threat levels (in the UK these are low/moderate/substantial/severe/critical), etc.
The other main type of data (see Fig. 1.4) is called continuous, or quantitative, for example data on variables “blood pressure”, “age” and “income”. These are observations of variables on continuous scales, usually rounded in some convenient way. For example, although age is a continuous time variable, and we are getting older all the time by seconds, minutes and hours, someone’s age is almost always rounded to the number of years completed. There is a subtle difference between interval-scale and ratio-scale continuous data, which is worth mentioning here. Age is an interval-scale variable: to compare two children of ages 10 and 12, we would compute the interval difference, i.e. 2 years. We would not say the 12-year old is 20% older than the 10-year old. But comparing prices or incomes, for example, we would tend to compute percentage differences, making them ratio-scale variables. A good example is the inflation rate, comparing the prices of a basket of products over time, not as a difference but as a percentage. As a general rule, most data on monetary values and those coming from physical measurements (e.g., lira, gold price, centimeters, kilograms) are ratio-scale variables.
As also understood from the information given, the correct answer is I, II, III and IV.
Soru 39
- A group of tourists entering Turkey
- Which country they come from
- How many days they plan to stay
- What their tourism objectives are
Which of the above is/are case(s)?
Seçenekler
A
Only I
B
I and II
C
I and III
D
I, II and III
E
II, III and IV
Açıklama:
Data come in various forms and are measured in different ways. For example, a doctor measures your blood pressure with an instrument, a survey researcher asks you a question and you give a verbal response, you go on holiday to a particular country, you are at a certain age and have a certain income, you have a grade for a completed university course, or this past week you have gone to the supermarket a certain number of times, and bought a certain basket of products, etc. Blood pressure, question response, country, age, income, course grade, number of supermarket visits and purchased products, these are all statistical variables. The observations made on these variables constitute the data. The subjects or individuals or companies on which these observations are made are called cases. Thus, cases might be a group of tourists entering Turkey, for each of whom we have data on which country they come from, how many days they plan to stay in Turkey, what their tourism objectives are (e.g., cultural events, beach holiday, etc.). Or cases might be hospital patients, on whom we have measured the standard medical indicators such as blood pressure, cholesterol levels, blood sugar, and so on.
As also understood from the information given a group of tourist entering Turkey is case, so the correct answer is A group of tourists entering Turkey. “which country they come from”, “how many days they plan to stay” and “what their tourism objectives are” are statistical variables.
As also understood from the information given a group of tourist entering Turkey is case, so the correct answer is A group of tourists entering Turkey. “which country they come from”, “how many days they plan to stay” and “what their tourism objectives are” are statistical variables.
Soru 40
- Region of Residence
- Field of Study
- Type of Transport
- Type of Housing
- Exam Grade
Which of the above are nominal categorical variables?
Seçenekler
A
I and II
B
I, II and III
C
II, III and IV
D
I, II, III and IV
E
II, III, IV and V
Açıklama:
The easiest form of data is called categorical, or qualitative, for example data on variables “country” (e.g., the data observation might be Germany) or “question response” (e.g., believe that climate change is manmade) or “exam grade” (e.g., B). Categorical variables and data can be either nominal or ordinal. The question about climate change, with possible responses “natural”, “manmade” or “don’t know/can’t answer” is a nominal categorical variable, as is the variable “country” - there is no ordering in the categories of these variables. By contrast, exam grade is an ordinal categorical variable, since its categories are ordered: A is better than a B, B is better than a C, and so on.
Other examples of nominal categorical variables are gender, region of residence, field of study, type of transport, type of housing, etc.
Other examples of ordinal categorical variables are income group (if incomes have been categorized), an attitude question in a survey where possible responses are strongly agree/agree/disagree/strongly disagree (these categories have an order), social class (with classes usually in an inherent order), terrorist threat levels (in the UK these are low/moderate/substantial/severe/critical), etc.
As also understood from the information given, “Region of Residence”, “Field of Study”, “Type of Transport” and “Type of Housing” are nominal categorical variables. Exam grade is ordinal categorical variable.
Soru 41
- Age
- Hours of Sleep
- The Inflation Rate
- Gold Price
- Time to Run 100 meters
Which of the above are interval-scale variables?
Seçenekler
A
I and II
B
III and IV
C
I, II and V
D
II, III and IV
E
III, IV and V
Açıklama:
The other main type of data (see Fig. 1.4) is called continuous, or quantitative, for example data on variables “blood pressure”, “age” and “income”. These are observations of variables on continuous scales, usually rounded in some convenient way. For example, although age is a continuous time variable, and we are getting older all the time by seconds, minutes and hours, someone’s age is almost always rounded to the number of years completed. There is a subtle difference between interval-scale and ratio-scale continuous data, which is worth mentioning here. Age is an interval-scale variable: to compare two children of ages 10 and 12, we would compute the interval difference, i.e. 2 years. We would not say the 12-year old is 20% older than the 10-year old. But comparing prices or incomes, for example, we would tend to compute percentage differences, making them ratio-scale variables. A good example is the inflation rate, comparing the prices of a basket of products over time, not as a difference but as a percentage. As a general rule, most data on monetary values and those coming from physical measurements (e.g., lira, gold price, centimeters, kilograms) are ratio-scale variables. Other measures of time are interval-scale variables (the word “interval” gives you a clue to that!), for example hours of sleep (on Sundays I sleep an hour longer - I would not say I sleep 14% longer) and time to run 100 meters (e.g., at the 2009 World Championships in Berlin, Usain Bolt shaved more than a tenth of a second off his record, clocking 9.58 seconds - we wouldn’t say he reduced the time from 9.69 seconds by 1.1%).
As also understood from the information given “Age”, “Hours of Sleep” and “Time to Run 100 meters” are interval scale variables, so the correct answer is I, II and V. “The Inflation Rate” and “Gold Price” are ratio-scale variables.
As also understood from the information given “Age”, “Hours of Sleep” and “Time to Run 100 meters” are interval scale variables, so the correct answer is I, II and V. “The Inflation Rate” and “Gold Price” are ratio-scale variables.
Soru 42
- Frequently occurring words
- The lengths of sentences
- The number of words used just once
- Verbal responses in questionnaires
- Social media posts
Which of the above need recoding in order to create quantitative variables?
Seçenekler
A
I and II
B
II and III
C
IV and V
D
I, II and V
E
III, IV and V
Açıklama:
The world today abounds in textual data. Words, SMSs, tweets, social media posts, verbal responses in questionnaires, these can all be treated as data. Some recoding will be necessary, since text is not numerical. Frequently occurring words can be counted, the lengths of sentences can be measured, the number of words used just once can be identified, and so on, in order to create quantitative variables from text. Textual data have been used, for example, in identifying the author of threatening letters, in comparing political party manifestos, in classifying respondents in a survey who give answers to open-ended questions.
As also understood from the information given, the correct answer is IV and V. “Verbal responses in questionnaires” and “Social media posts” need recoding in order to create quantitative variables. “Frequently occurring words”, “The lengths of sentences” and “The number of words used just once” are the ones which are recoded in order to create quantitative variables.
As also understood from the information given, the correct answer is IV and V. “Verbal responses in questionnaires” and “Social media posts” need recoding in order to create quantitative variables. “Frequently occurring words”, “The lengths of sentences” and “The number of words used just once” are the ones which are recoded in order to create quantitative variables.
Soru 43
- A study which aims to find some evidence of a result
- A study which aims to find causes of a result
- A study in which the groups are “balanced” in terms of known factors
- A study conducted where conditions are controlled
Which of the above can be given as an example/examples of observational studies?
Seçenekler
A
Only I
B
I and II
C
I and IV
D
II and IV
E
II, III and IV
Açıklama:
A study that involves Statistics will clearly involve a process of data collection. But there are differences in study objectives which are important to recognize. The main distinguishing factor is whether the study aims to find some evidence of a result or whether it aims to find causes of a result. Medical research is a good context to understand these differences - Statistics in medical research is often called Biostatistics.
It is true that many benefits have been detected of taking a low-dosage of aspirin every day. For example, it has been observed that people who take aspirin regularly (less than 300 mg per day) generally have less health problems such as heart attacks, strokes and cancers. The keyword is “observed”: in a community health study involving thousands of people there will be many that take aspirin regularly for problems such as back pain or headaches. For those people it could be observed that they have less chronic diseases compared to people who don’t take aspirin. This is evidence of a difference, but it does not prove that aspirin is the actual cause of the improved health. People who do not take aspirin daily might be poorer and neglect taking medication, and they suffer from more chronic diseases than people with a higher income, so the real difference is socio-economic. From such an observational study it is not possible to conclude a causal effect, it just gives some tentative evidence of a possible relationship between the treatment and the outcome.
In order to be able to prove that aspirin is the cause of the improvement in health, an experiment needs to be conducted where conditions are controlled between those taking aspirin and those not taking it. Such an experiment might be designed as follows, restricted to men, for example, since the effects are suspected to be different for men and women. Suppose we take a large group of men in the age group 60- 70 years of age that have no history of chronic disease. We divide them into two groups so that the groups are “balanced” in terms of known factors such as age, social class, and so on (we don’t want one group to have older men than the other). By the way, this “dividing into two groups” is not a trivial matter, but that is a subject for later in this course. Assuming the two groups are comparable, then one group is given the daily low dose of aspirin and the other not, and the groups are followed up for a five-year period and then compared for the incidence of health problems that develop during this time. If the group taking aspirin has less health problems, this would indicate a beneficial effect caused by the aspirin.
This type of experiment on people has all sorts of problems, but it is really leading to a conclusion about whether aspirin is the real cause of differences between the two groups. There is the ethical problem of not giving the daily aspirin, which has suspected benefits, to a large group of people. There is also the problem that one group knows it is taking the medication and might change their lifestyle to favour a good outcome by living more healthily. This effect can be eliminated by not telling either group what they are getting and giving the non-aspirin group a so-called placebo, which is medication in the form of an aspirin, so both groups think they are getting the medication.
As also understood from the information given, “A study which aims to find some evidence of a result” is an example of observational studies, so the correct answer is only I. “A study which aims to find causes of a result”, “A study in which the groups are “balanced” in terms of known factors” and “A study conducted where conditions are controlled” are the examples of experimental studies.
Soru 44
- Statistics
- Computer Science
- Database Management
- Data Visualization
- Analytics
Which of the above really mean the same thing?
Seçenekler
A
I and II
B
I and III
C
II and III
D
III and IV
E
I and V
Açıklama:
To deal with Analytics first, this is a term now used in business circles as a substitute for the word Statistics, but it really means the same thing. The word Statistics is considered by some people, especially businessmen, as a bit old-fashioned, and sometimes even difficult to pronounce! But don’t be fooled: Analytics is a fancy word for Statistics. When it comes to Data Science, however, the term does have some different meaning. Data Science is a field that includes Statistics as well as areas such as Computer Science, Database Management and Data Visualization, for example, and has come into being mainly as a result of the spectacular growth in the amount of available data in this new information world that we live in. The need has been recognized for someone who not only has statistical skills, but also advanced programming skills and knowledge about handling huge data sets, the so-called “Big Data” of today. Thus a new profession has been born, that of the Data Scientist. Again, don’t be fooled: the main skill of a data scientist is knowledge of Statistics,
As also understood from the information given, the correct answer is I and V. “Statistics” and “Analytics” really mean the same thing. Statistics, Computer Science, Database Management and Data Visualization are the areas which Data Science includes. They do not mean the same thing.
As also understood from the information given, the correct answer is I and V. “Statistics” and “Analytics” really mean the same thing. Statistics, Computer Science, Database Management and Data Visualization are the areas which Data Science includes. They do not mean the same thing.
Soru 45
- Commerce, especially online electronic commerce
- Finance, for example share prices on stock markets, all managed electronically
- Insurance, all the premiums, incidents, actuarial transactions in an insurance company
- Biomedicine, especially in genetics, where information is literally exploding as gene-sequencing reveals and codes the total genetic profile of a person
- Transport, for example in the airline industry, all the flights, all the passengers
- Climate data, measurements from tens of thousands of weather stations across the world
In which of the areas above are big data mostly found?
Seçenekler
A
I, II and III
B
III, IV and V
C
IV, V and VI
D
I, II, III, IV and V
E
I, II, III, IV, V and VI
Açıklama:
What are the “big data” sets today and where do they come from? These are mostly found in the following areas:
As also understood from the list given, the correct answer is I, II, III, IV, V and VI.
- Commerce, especially online electronic commerce
- Finance, for example share prices on stock markets, all managed electronically
- Insurance, all the premiums, incidents, actuarial transactions in an insurance company
- Biomedicine, especially in genetics, where information is literally exploding as gene-sequencing reveals and codes the total genetic profile of a person
- Transport, for example in the airline industry, all the flights, all the passengers
- Climate data, measurements from tens of thousands of weather stations across the World
As also understood from the list given, the correct answer is I, II, III, IV, V and VI.
Soru 46
Which of the following is not done by using statistics?
Seçenekler
A
weather forecast
B
gain estimation
C
process time prediction
D
exam grade classification
E
password validation
Açıklama:
password validation. pg. 3. Correct answer is E.
Soru 47
Which of the following are not variables?
Seçenekler
A
exam grade
B
words in sentence
C
your Anadolu University student number
D
radio waves
E
class
Açıklama:
Your Anatolian University student number is data, not variable. pg. 14. Correct answer is C.
Soru 48
Which of the following is not data?
Seçenekler
A
eyeglass
B
94.3 Mhz TRT 3 FM
C
Anadolu University Statistics Department
D
Anadolu University Yunus Emre Campus
E
Porsuk river
Açıklama:
eyeglass is variable, not data. pg. 14. Correct answer is A.
Soru 49
What type of variable is your heart beat?
Seçenekler
A
qualitative ordinal
B
qualitative nominal
C
continuous regular
D
quantitative ratio
E
quantitative interval
Açıklama:
quantitative interval. pg. 8. Correct answer is E.
Soru 50
What type of variable is your mood which gets values good or normal or bad?
Seçenekler
A
continuous regular
B
qualitative nominal
C
qualitative ordinal
D
quantitative interval
E
quantitative ratio
Açıklama:
qualitative ordinal. pg. 14. Correct answer is C.
Soru 51
Is your answer to this question variable?
Seçenekler
A
Maybe
B
Sometime
C
It depends on time
D
No
E
Yes
Açıklama:
No, it is data. pg. 14. Correct answer is D.
Soru 52
What type of variable is your answer to a job offer?
Seçenekler
A
continuous regular
B
quantitative ratio
C
quantitative interval
D
qualitative nominal
E
qualitative ordinal
Açıklama:
qualitative nominal. pg. 14. Correct answer is D.
Soru 53
Which of the following is not big data?
Seçenekler
A
Eskişehir’s food order website’s visitor traffic
B
internet traffic of Eskişehir Train Station Free Wi-Fi
C
phone call traffic in Eskişehir
D
Anadolu University TV's broadcast
E
Eskişehir Yunus Emre Hospital's user traffic
Açıklama:
Anadolu University TV's broadcast. pg. 11. Correct answer is D.
Soru 54
Which of the following is not variable?
Seçenekler
A
depth
B
darkness
C
noise
D
sense
E
feeling
Açıklama:
darkness is data, not variable. pg. 14. Correct answer is B.
Soru 55
Which of the following is not data?
Seçenekler
A
Eskişehir
B
Eskişehir train station
C
Eskişehir's pirate ship
D
Eskişehir's beach's users
E
Anadolu University airport
Açıklama:
Eskişehir's beach's users is variable, not data. pg. 14. Correct answer is D.
Soru 56
Your body temperature changes through exercises.
What type of variable is it?
What type of variable is it?
Seçenekler
A
A textual variable
B
A continuous interval-scale variable
C
An ordinal categorical variable
D
A nominal categorical variable
E
A continuous ratio-scale variable
Açıklama:
There is no absolute zero in the temperature measurements. So body temperature is a continuous interval-scale variable.
Soru 57
Students in a course get a grade, either "AA", "BA", "BB", or "BC", etc. What type of variable is the grade?
Seçenekler
A
A continuous interval-scale variable
B
A textual variable
C
An ordinal categorical variable
D
A continuous ratio-scale variable
E
A nominal categorical variable
Açıklama:
Grades like "AA" or "BB" taken from a course is an ordinal categorical variable.
Soru 58
Which of the following matches is wrong?
Seçenekler
A
Nominal-Country
B
Ordinal-Olimpic Gold Medalist
C
Interval-Temperature
D
Continuous-Age
E
Interval-Time to run 100 meters
Açıklama:
Age is an interval-scale variable: to compare two children of ages 10 and 12, we would compute the interval difference, i.e. 2 years. We would not say the 12-year old is 20% older than the 10-year old.
Soru 59
Which of the following are not data?
Seçenekler
A
Age
B
Blood sugar
C
Cholesterol levels
D
Gender
E
Hospital patient
Açıklama:
The subjects or individuals or companies on which these observations are made are called cases. Hospital patients on whom we have measured the standard medical indicators such as blood pressure, cholesterol levels, blood sugar, and so on might be cases.
Soru 60
A national sport committee decides to impose stricter conditions for athletes to enter the tournament. One year later, athletes obtain scores that are in general better than those the year before.
Which of the following can be considered as valid conclusions?
Which of the following can be considered as valid conclusions?
Seçenekler
A
The increase in scores might be attributable to the introduction of stricter entry conditions.
B
The imposition of stricter entry conditions caused the increase in scores.
C
The imposition of stricter entry conditions could not possibly have caused the increase in scores.
D
There is not enough information, we need to collect more data.
E
We cannot conclude anything either way.
Açıklama:
A national sport committe decides to impose stricter conditions for athletes to enter the tournament. One year later, athletes obtain scores that are in general better than those the year before. The increase in scores might be attributable to the introduction of stricter entry conditions.
Soru 61
Which of the following cannot be considered as a field of big data?
Seçenekler
A
Biomedicine
B
Transport
C
Astrology
D
Climate data
E
Electronic commerce
Açıklama:
Bigdata are mostly used in following areas:
- Commerce (especially online electronic commerce),
- Biomedicine (especially in genetics), climate data,
- Transport (for example in the airline industry)
- Climate data
- Insurance
- Finance
Soru 62
A survey on married couples asked the following questions: "What is your gender? Woman or Man"
Which type of data requested in the question?
Which type of data requested in the question?
Seçenekler
A
A textual variable
B
An ordinal categorical variable
C
A continuous ratio-scale variable
D
A nominal categorical variable
E
A continuous interval-scale variable
Açıklama:
Gender is a nominal categorical variable.
Soru 63
Which of the following do not constitute “big data”?
Seçenekler
A
All the comments written on Facebook page
B
All comments posted on Youtube video
C
All men basketball player statistics in one season
D
All football teams statistics in Turkish Super League
E
All data that are very large numbers, every value in the billions and trillions
Açıklama:
Big Data are all forms of data we have obtained from different sources and transformed into meaningful and workable forms. All data that are very large numbers, every value in the billions and trillions do not constitute "big data" because cannot be transformed into meaningful and workable forms.
Soru 64
A study was conducted to determine the effects of two different training programs on athletes. Sixty athletes were randomly assigned into two training programs each including 30 athletes. One group is given only coffee and water to drink before trainings while the other group is given only water to drink before trainings. After training programs, an assessment test was applied to the athletes. One month later, the group who had drunk coffee and water before the trainings progressed more than the group who only had drunk water before the trainings.
What do you think is the most acceptable conclusion of this experiment?
What do you think is the most acceptable conclusion of this experiment?
Seçenekler
A
The sample size is too small to conclude anything at all; if this was done on bigger samples of people, the evidence one way or the other would be more solid.
B
This result is definitely a result of random variation and no attention should be paid to it.
C
We cannot conclude anything either way, since this is done just for two groups of athletes.
D
This result constitutes tentative evidence of the benefits of coffee to athletes.
E
Drinking coffee and water on pre-trainings appears to be beneficial to athletes. An experiment with more athletes should be undertaken.
Açıklama:
The paragraph is an example of experimental design in sports science. So, drinking coffee and water on pre-trainings appears to be beneficial to athletes. More experiments with more athletes should be undertaken in other conditions and controls.
Soru 65
- A market researcher's surveying customers
- A teacher's qualitative inquiry of motivation
- A psychologist's measure of addiction level
Seçenekler
A
Only II
B
I and II
C
I and III
D
II and III
E
I, II and III
Açıklama:
Statistics mainly work on numerical data. Qualitative inquiry is not an interest of statistics.
Soru 66
- Any person have free access to data in the world
- Data may be in form of text or numbers
- All observations can be reduced to some numerical quantity
Seçenekler
A
Only I
B
I and II
C
I and III
D
II and III
E
I, II and III
Açıklama:
Data come in the form of numbers as well as text, which is something we are discovering more and more. We live in an information world and information is the virtual gold of our society. All observations can be reduced to some numerical quantity, and there are even fields of digital philosophy and digital sociology. It may seem that everything may be recorded and stored somewhere. But in reality - unless we somehow centralize and link all the databases in the world, and have free access to them - we can get access to only a small part of whatever data we are interested in.
Soru 67
Assume that you are investigating the smart phone preferences of people living in Turkey and you surveyed 2000 people in Denizli.
What can you say about results?
What can you say about results?
Seçenekler
A
Can give statistical estimates of preferences of Turkish people
B
Cannot say anything about people live in Turkey
C
Should gather more data from Denizli
D
Can present exact proportions of preferences in Turkey
E
Can present exact proportions of preferences in Denizli
Açıklama:
A reasonable survey would carefully select people as a sample and gathering data from Denizli would not represent Turkey. Statistics working on samples cannot give absolutely correct information. Sample being carefully selected, it can give a statistical estimate of proportions.
Soru 68
Your professor is surveying you and asking your gender, hometown and branch. What form of data is s/he dealing with?
Seçenekler
A
nominal
B
ordinal
C
interval
D
ratio
E
continuous
Açıklama:
Data such as gender, hometown and branch do not represent a computational score. They can only be used to categorize the sample.
Soru 69
A teacher labels students successful, average and unsuccessful based on their exam marks. What form of data does s/he produce?
Seçenekler
A
numerical
B
ordinal
C
interval
D
ratio
E
continuous
Açıklama:
Data labeled as successful, average and unsuccessful does not represent a computational score but does represent an order. So, it is an ordinal data.
Soru 70
A scientist is studying on the yearly average temperatures in Celsius in last 100 years. What measurement type is s/he studying on?
Seçenekler
A
nominal
B
ordinal
C
interval
D
ratio
E
categorical
Açıklama:
Temperature in Celsius does not have an absolute zero. Talking about 20 degrees and 40 degrees, you cannot say its twice warmer but you can say it is 20 degrees more/less. So, the measurement is interval.
Soru 71
Your professor asked you to write an essay and stated that you would be assessed for the count of words in your essay. What form of numerical data would s/he study on?
Seçenekler
A
nominal
B
ordinal
C
interval
D
ratio
E
qualitative
Açıklama:
Because the difference in the counts of words could be stated in percentages, it is a ratio type of measurement.
Soru 72
A researcher wants to investigate the effects of tea on heart diseases. What should the researcher do in order to conclude a causal effect?
Seçenekler
A
Ask a sample if they have a heart disease and how much tea they drink a day
B
Ask the patients with heart problems whether they are drinking tea
C
Give tea to a sample and observe what they are doing
D
Conduct an experiment with control and treatment groups
E
Survey a sample about their beliefs on the effect of tea on heart diseases
Açıklama:
In order to prove whether tea has an effect on heart diseases, an experiment needs to be conducted where conditions are controlled.
Soru 73
Widespread social media platforms you visit everyday are gathering information about your profile, friends, tendencies, behaviors and so. What are they working on?
Seçenekler
A
Identity theft
B
Security
C
World peace
D
Climate change
E
Big data
Açıklama:
When it comes to Data Science, however, the term does have some different meaning. Data Science is a field that includes Statistics as well as areas such as Computer Science, Database Management and Data Visualization, for example, and has come into being mainly as a result of the spectacular growth in the amount of available data in this new information world that we live in. The need has been recognized for someone who not only has statistical skills, but also advanced programming skills and knowledge about handling huge data sets, the so-called “Big Data” of today.
Soru 74
- Commerce
- Insurance
- Transport
In which areas above do big data set could be found?
Seçenekler
A
Only I
B
Only III
C
I and II
D
II and III
E
I, II and III
Açıklama:
What are the “big data” sets today and where do they come from? These are mostly found in the following areas:
• Commerce, especially online electronic commerce
• Finance, for example share prices on stock markets, all managed electronically
• Insurance, all the premiums, incidents, actuarial transactions in an insurance company
• Biomedicine, especially in genetics, where information is literally exploding as gene-sequencing reveals and codes the total genetic profile of a person
• Transport, for example in the airline industry, all the flights, all the passengers
• Climate data, measurements from tens of thousands of weather stations across the world
Soru 75
(I) The voting age is 18 in Turkey. There are 56 million people who are able to vote in Turkey.
(II) Before election, a public opinion poll was conducted with 2000 people.
(III) In this poll, 2000 people stated the party of their choice.
Which terms in the statements I, II and III above correspond to the following concepts in the statistics?
(II) Before election, a public opinion poll was conducted with 2000 people.
(III) In this poll, 2000 people stated the party of their choice.
Which terms in the statements I, II and III above correspond to the following concepts in the statistics?
Seçenekler
A
I-Categorical data
II- Variable
III- Population
II- Variable
III- Population
B
I-Variable
II- Interval scale
III- Sample
II- Interval scale
III- Sample
C
I-Ratio scale
II-Continuous variable
III- Sample
II-Continuous variable
III- Sample
D
I-Population
II- Sample
III- Data
II- Sample
III- Data
E
I-Mean
II- Sample
III- Ordinal scale
II- Sample
III- Ordinal scale
Açıklama:
These terms are the basic concepts in statistics which are population, sample and data.
A population data set contains all members of a specified group (the entire list of possible data values). In this question, 56 million people show the entire population that can vote in the country.
A sample contains a part, or a subset, of a population. The size of a sample is always less than the size of the population from which it is taken. Here, instead of asking 56 million people in the process of public opinion poll, 2000 people selected from the entire population. We call this groups as sample.
Data are individual pieces of factual information recorded and used for the purpose of analysis. These 2000 people were asked which party they would vote for and their responses were recorded as data.
Soru 76
"The number of applications downloaded to a phone".
What is the level of measurement in this problem?
What is the level of measurement in this problem?
Seçenekler
A
Interval
B
Ordinal
C
Nominal
D
Textual
E
Ratio
Açıklama:
This is a ratio measure. It is ratio scale because it has a true value of 0 (no downloads at all). If your answer is incorrect, please review “Measurement Scales” section in the first chapter.
Soru 77
What is the level of measurement of times of day as "Dawn, Morning, Noon, Afternoon, Evening, Night"
Seçenekler
A
Interval
B
Nominal
C
Ordinal
D
Textual
E
Ratio
Açıklama:
The ordinal scales are categorical variables and typically measures of non-numeric concepts. This type of variable classifies according to rank.
Soru 78
I- IQ levels (intelligence scale)
II- Weights of newborn babies
III-Monthly Income
IV-Types of blood such as A, B, AB and O
V-Level of Agreement: yes, maybe, no
In which of the variables given above, the level of measurement is ratio?
II- Weights of newborn babies
III-Monthly Income
IV-Types of blood such as A, B, AB and O
V-Level of Agreement: yes, maybe, no
In which of the variables given above, the level of measurement is ratio?
Seçenekler
A
I - II
B
I-III
C
I-V
D
II-III
E
IV-V
Açıklama:
Only II and III are ratio variables.
I- IQ (intelligence scale): This is an interval variable. It has values of equal intervals that mean something but there is not an absolute zero. In other words, zero IQ does not mean you do not have any cognitive abilities.
II- Weights of newborn babies: This variable is continuous and ratio. It is continuous because weights (kg, g, mg or etc.) can be broken down into very small amounts.Ratio scales have a clear definition of zero.
III-Income earned in a month: It is also ratio because it has an absolute zero and the ratios are meaningful.
IV-Types of blood as A, B, AB and O. This variable is categorical and nominal: The type of blood tells us something meaningful (dominant or recessive genes etc.) but has no meaningful order.
V-Level of Agreement: yes, maybe, no. This is an ordinal variable and the order of categories cannot quantify-how much better it is. For example, is the difference between “Yes” and “Maybe” the same as the difference between “Maybe” and “No” ? We can’t say.
Soru 79
What is the level of a measurement for a variable with outcomes defined as "completely agree", "mostly agree", "neutral", "mostly disagree", "completely disagree" when measuring people's opinion about a particular subject?
Seçenekler
A
Interval
B
Ratio
C
Ordinal
D
Textual
E
Nominal
Açıklama:
This is an ordinal (categorical) scale because ordinal scales provide an information about the order of choices, such as in a people opinion survey.
Soru 80
A researcher believes that playing piano is the explanation for increased mathematics academic success. In order to get an understanding on this, the researcher collected data by conducting a survey, asking elementary students his or her level of math ability (grades) and whether they play a piano or not.
Which of the following statements about the research is wrong?
Which of the following statements about the research is wrong?
Seçenekler
A
The elementary students' characteristics cannot be manipulated
B
The research problem is about a causal relationship
C
This type of study refers to an observational research
D
The researcher has no control of the variables
E
The researcher can only describe the phenomena as they exist
Açıklama:
This is an observational study. Observational research is non-experimental because nothing (variables, participants etc.) is manipulated or controlled, and as such we cannot arrive at causal conclusions using this approach. the goal is to obtain a snapshot of specific characteristics of an individual, group, or setting.
Soru 81
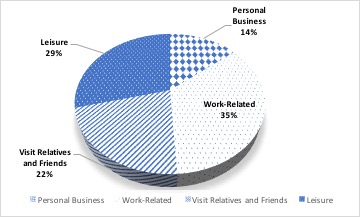
What type of measurement level is the reason for the people to travel shown in the figure above?
Seçenekler
A
Interval
B
Nominal
C
Ordinal
D
Ratio
E
Textual
Açıklama:
The pie graph shows a nominal variable.A nominal scale describes a variable with categories that do not have a natural order or ranking. Here, the frequency of the categories of the nominal variable is shown in percentages. Numbers do not indicate that the variable is a numerical variable, it just refers to the frequency of the categories.
Soru 82
A researcher wants to know if field trips will improve science academic achievement. For this purpose, it forms two separate groups from 6th grade students. One of the groups regularly goes to field trips (museum visits, science centers, etc.) once a week for 1 year. Students in the other group only take science lessons in the classroom. Science academic achievements of children are measured and compared periodically throughout the year.
Which of the following statements about this research is correct?
Which of the following statements about this research is correct?
Seçenekler
A
The science course's related variables cannot be manipulated
B
The researcher has no control of the variables
C
The research problem is about a causal relationship
D
This type of study refers to an observational research
E
The researcher can only describe the phenomena as they exist
Açıklama:
It shows an experimental research. Experiment is a type of study designed specifically to answer the question of whether there is a causal relationship between at least two variables. In other words, whether changes in an independent variable (science course design: with field trip or without field trip) cause a change in a dependent variable (science academic achievement). Experiments have two fundamental features. The first is that the researchers manipulate , or systematically vary, or control the level of the independent variable.
Soru 83
Which of the following is a newborn concept relative to others in statistics?
Seçenekler
A
Big data
B
Geometric mean
C
Observational research
D
Median
E
Experimental Data
Açıklama:
Big data refers to the large, diverse sets of information that grow at ever-increasing rates. It encompasses the volume of information, the velocity or speed at which it is created and collected, and the variety or scope of the data points being covered. Big data often comes from multiple sources and arrives in multiple formats. Other concepts are old terms commonly used in statistics.
Ünite 2
Soru 1
Statistical analysis requires that the factual information of interest in a research be collected and organized in a useful manner. Which one below refers to such facts?
Seçenekler
A
Element
B
Data sets
C
Data
D
Variable
E
Case
Açıklama:
Statistical analysis requires that the factual information of interest in a research be collected and organized in a useful manner. Such facts are described as data.
Soru 2
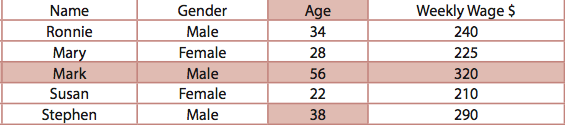 Which statement below is correct about the table above?
Seçenekler
A
"Gender" is a quantitative data.
B
"Stephen" is a data set.
C
"Ronnie" is a qualitative data.
D
"Age" is a qualitative data.
E
"Susan" is an element.
Açıklama:
A data set is a collection of facts aggregated for a specific purpose. Elements are the entities on which the data are collected. In the table above, an element of the data set is a particular worker. For instance, worker "Ronnie" is an element of the data set. Age is a quantitative variable because it takes on numerical measurements. However, gender is a qualitative variable because its outcomes are nonnumeric. Of the four variables in the data set in the table above, two are qualitative (Name and Gender) and two are quantitative (Age and Weekly Wage).
Soru 3
Which statements below are correct about the table above?
I Mark's weekly wage being 320 is a data set.
II Being 56 years old male, Mark's earning 320 dollars per week is a case.
III Mark's being male is a qualitative data.
IV Mark's being 56 years old is a qualitative data.
Seçenekler
A
Only I
B
II and III
C
III and IV
D
II, III and IV
E
All of the above
Açıklama:
The outcomes obtained on all variables for one element in the data set is called a case. Sometimes a case is defined as a record or observation vector. For example, in the table above the outcomes on the four variables for worker Mark constitutes a case.
Soru 4
There are four participants in our research and their names are Tom, Jane, Tim and Beth. We assign arbitrarily 1 for Tom, 2 for Jane, 3 for Tim and 4 for Beth. Which word below describes the meaning of number 4 in our research?
Seçenekler
A
case
B
nominal data
C
numeral
D
observation
E
ordinal scale
Açıklama:
Nominal scales of measurement classify things or individuals into qualitatively different classes. For example, the variable gender has two categories, female and male. Thus, researches could describe sex of the workers using a nominal scale by categorizing people as female and male. Typically, we can use numerals instead of strings to represent individuals’ genders. For example, we can arbitrarily assign number 0 for females and number 1 for males.
Soru 5
We ask the students to number the most important language skill for them in their academic classes as 1 and the least important one as 2. Which option below best describes this measurement?
Seçenekler
A
Ordinal scale
B
Nominal scale
C
Interval Scale
D
Ratio Scale
E
None of the above
Açıklama:
Ordinal scales of measurement have the property of both classifying and magnitude. Subjects are categorized into different rank ordered groups. Each value on the ordinal scale has a unique meaning, and it has an ordered relationship to every other value on the scale. Suppose we want to measure customers’ preferences for five brands of chocolates, brands A, B, C, D, and E. We could ask each customer to rank order the five brands by assigning number 1 to the most preferred brand, number 2 to the next most preferred brand, and so on.
Soru 6
In this type of measurement scale, there is a natural or zero-valued base value that cannot be changed. What is the name of this scale?
Seçenekler
A
Nominal Scale
B
Ordinal scale
C
Cardinal Scale
D
Interval Scale
E
Ratio Scale
Açıklama:
Ratio scales of measurement, in addition to having all properties of the interval scale, have a natural or zero-valued base value that cannot be changed. For example, an individual’s age, weight, height, systolic blood pressure are ratio scale variables because they have natural base value. For example, John and Mary are 20 and 40 years old, respectively. We can say that Mary is two times older than John.
Soru 7
In order to investigate the impact of playing online games on developing English speaking skills, we make a group of students play online games for four hours a day and prevent another group of students playing any English online games. What type of research we are conducting?
Seçenekler
A
Case
B
Sampling
C
Observational
D
Experimental
E
Interval
Açıklama:
Experimental study is a study in which the researcher manipulates some of the variables and try to determine how the manipulation influences other variables. In an experimental study, one or more independent variables are controlled so as to obtain information about their influence on the dependent variable. However, researchers cannot control all the variables having effects on the dependent variable. In this case, randomization techniques are applied to balance out the influence of any uncontrolled variable that might affect the variable of interest. Suppose we want to investigate the effects of exercise on cold by using an experimental design. For this purpose, we obtain a group of individuals who are the volunteers to participate the study. Then, we randomly assign the participants to the treatment (exercise) and control (no exercise) groups. After a lapse of time, we record the number of colds for each individual from the two experimental groups.
Soru 8
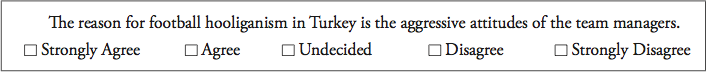 Which type of response does the question above require?
Seçenekler
A
Open-ended response
B
Multiple response
C
Ranked response
D
Rated response
E
Clarity response
Açıklama:
Rated responses generally include three-point, five-point, and seven-point scales. A rating scale should provide more than two options. The mostly used rating scale is five-point Likert (1932) type scale. Likert type scale can be designed in the following forms.
- Strongly Agree - Agree - Undecided / Neutral - Disagree - Strongly Disagree
- Always - Often - Sometimes - Seldom - Never
- Extremely - Very - Moderately - Slightly - Not at all
- Excellent - Above Average - Average - Below Average - Very Poor
Soru 9
Which one below is one of the limitations of interview method?
Seçenekler
A
The individuals included in the study might alter their behavior.
B
Direct contact with the responders avoids misunderstanding of the questions.
C
People will tend to give answers to the question when they are approached personally.
D
The data collection by interview usually includes irrelevant information from those people who are conducted.
E
The researcher may select an irrelevant individual about the study, this leads to bias into the results.
Açıklama:
The advantages of the data collection by interview are:
1. People will tend to give answers to the question when they are approached in person or by telephone, so the data collection by interview usually includes usable information from those people who are conducted.
2. Direct contact with the responders avoids misunderstanding of the questions.
On the other hand, the limitations of the interviewing method are:
- If the questioner does not obey the rules for selecting individuals or may select an irrelevant individual about the study, this leads to bias into the results.
- The questioner may affect the individuals’ opinion about a question and this leads to get incorrect answers.
- The questioner may make recording errors.
Soru 10
A university student who successfully completed the course filled out the assessment questionnaire about the lecturer. What type of research method is mentioned here?
Seçenekler
A
Observation
B
Interview
C
Self-enumeration
D
Open-ended
E
Frequency
Açıklama:
In a self-enumeration method, individuals answer the questions printed on a questionnaire paper, or displayed on a computer monitor. In other words, self-enumeration method refers to the completion of survey questionnaires by the respondents themselves. Some of the examples are as follows:
- A recent customer checked out from a five-star hotel received a self-enumeration satisfaction questionnaire through the e-mail that request information about the hotel activities.
- A university student who successfully completed the course filled out the assessment questionnaire about the lecturer.
Soru 11
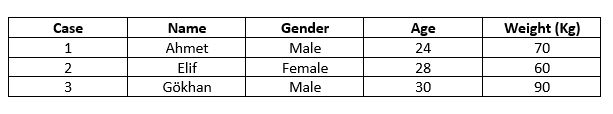
There is a data set of clinic’s patients above. Which of the following statements about this table is false?
Seçenekler
A
The weight in the table is a qualitative variable
B
In the table, an element of the data set is a particular patient, for example Ahmet
C
Age is a variable and takes on different values for different patients
D
90 kg is the observation on the variable weight for patient Gökhan
E
In the table, the outcomes on the four variables for patient Elif constitutes a case
Açıklama:
A data set is a collection of facts aggregated for a specific purpose. Elements are the entities on which the data are collected. In the table, an element of the data set is a particular patient. A variable is a characteristic of interest about an element. This characteristic takes on different values for different elements. The Gender and the name in the table are a qualitative variable because their outcomes are nonnumeric. Of the four variables in the data set in table, two are qualitative (Name and Gender) and two are quantitative (Age and Weight). The outcomes obtained on all variables for one element in the data set is called a case.
Soru 12
Which scales of measurement have a natural or zero-valued base value that cannot be changed?
Seçenekler
A
Ratio scale
B
Interval scale
C
Ordinal scale
D
Nominal scale
E
Qualitative scale
Açıklama:
Ratio scales of measurement, in addition to having all properties of the interval scale, have a natural or zero-valued base value that cannot be changed. For example, an individual’s age, weight, height.
Soru 13
Which scales of measurement have the properties of classifying, magnitude, and equal intervals?
Seçenekler
A
Ratio scale
B
Interval scale
C
Ordinal scale
D
Nominal scale
E
Quantitative scale
Açıklama:
Interval scales of measurement have the properties of classifying, magnitude, and equal intervals. While the ordinal scales of measurement show that individuals have more or less something than the others, interval scales have more precise information indicating how much of something individuals have.
Soru 14
Which of the following is an internal data source for the firm?
Seçenekler
A
Reference books
B
Newspapers
C
Sectoral magazines
D
Statistics published by governments
E
Firm’s accounting records
Açıklama:
We can obtain some data from an internal data source, such as an organization’s operating and accounting records. These routine data are usually saved in computer data files or databases for efficient entry, storage, and retrieval of information. Internal data is obtained from inside the company for successful operations. The information obtained from internal data source is important to determine the company strategies. We usually obtain data from external data sources. External data sources may be a reference book or statistical periodical published by a government agency, a trade association, or a private service company.
Soru 15
- Experimental study is a study in which the researcher manipulates some of the variables and try to determine how the manipulation influences other variables.
- In an observational study, researchers simply collect data based on what is seen and heard and infer based on the data collected.
- In an observational study, one or more independent variables are controlled so as to obtain information about their influence on the dependent variable.
Seçenekler
A
II
B
I, II
C
I, III
D
II, III
E
I, II, III
Açıklama:
Experimental study is a study in which the researcher manipulates some of the variables and try to determine how the manipulation influences other variables. In an observational study, researchers simply collect data based on what is seen and heard and infer based on the data collected.
Soru 16
- A researcher recorded the observed daily closing prices of several publicly traded common stocks for a financial study.
- A sales manager of a company conducted a research about purchases of a specific product of the company.
- A university student who successfully completed the course filled out the assessment questionnaire about the lecturer.
Seçenekler
A
I-Observation method, II-interview method, III-self-enumeration method
B
I-interview method, II-observation method, III-enumeration method
C
I-self-enumeration method, II-interview method, III-observation method
D
I-observation method, II-self-enumeration method, III - interview method
E
I-interview method, II-enumeration method, III- observation method
Açıklama:
Observation is making direct examination and taking measurements of an ongoing activity. In other words, observation is way of obtaining data by watching behavior, events, or noting physical characteristics in their natural setting. One of the most common methods of collecting data from individuals is interviewing. In an interview procedure, a researcher or observer asks the questions from a questionnaire and records the individual’s answers. In a self-enumeration method, individuals answer the questions printed on a questionnaire paper, or displayed on a computer monitor. In other words, self-enumeration method refers to the completion of survey questionnaires by the respondents themselves.
Soru 17
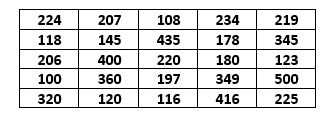 The above table contains the daily sales data of a market. We want to construct grouped frequency distribution table for the data. What is the class width of the data?
Seçenekler
A
80
B
90
C
100
D
110
E
120
Açıklama:
The first step in constructing the grouped frequency distribution table is to determine the number of classes.
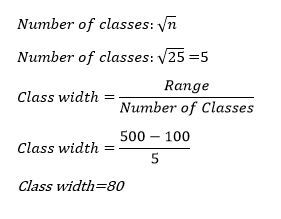
Soru 18
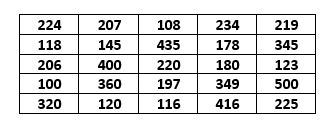 The above table contains the daily sales data of a market. We want to construct relative frequency distribution table for the data. What is the first class’ relative frequency?
Seçenekler
A
0,32
B
0,47
C
0,53
D
0,60
E
0,64
Açıklama:
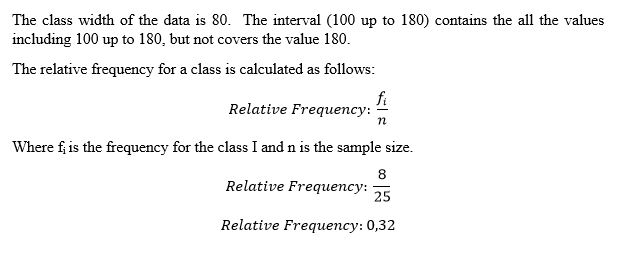
Soru 19
The frequency distribution table of the students’ performance scores of a school were constructed as follows. What is the ratio of the students whose score under 80?
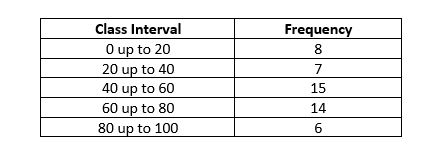
Seçenekler
A
0,88
B
0,84
C
0,80
D
0,73
E
0,70
Açıklama:
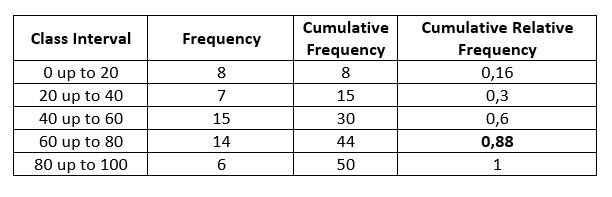 The ratio of the students whose score under 80 is 0,88
Soru 20
We ask each customer to rank order the three brands by assigning number 1 to the most preferred brand. Customers assigns Number 2 to the next most preferred brand and so on. Which scale is used in this study?
Seçenekler
A
Interval scale
B
Ratio scale
C
Ordinal scale
D
Nominal scale
E
Quantitative scale
Açıklama:
Ordinal scales of measurement have the property of both classifying and magnitude. Subjects are categorized into different rank ordered groups. Each value on the ordinal scale has a unique meaning, and it has an ordered relationship to every other value on the scale.
Soru 21
- Element
- Variable
- Concept
- Case
Seçenekler
A
I and II
B
II and III
C
I, II and III
D
I, II and IV
E
I, III and IV
Açıklama:
Several characteristics define a data set’s structure and properties. Element, Variable, Case and Observation are the key components of data sets.
Soru 22
Which of the followings could be a measure of a ratio scale?
Seçenekler
A
students' ranking in a class
B
different classes of same level
C
degree of attitude towards science class
D
gender of students in a class
E
weights of students in a class
Açıklama:
Ratio scales of measurement, in addition to having all properties of the interval scale, have a natural or zero-valued base value that cannot be changed. For example, an individual’s age, weight, height, systolic blood pressure are ratio scale variables because they have natural base value. For example, John and Mary are 20 and 40 years old, respectively. We can say that Mary is two times older than John.
Soru 23
Which of the following is the measurement of a magnitude without equal intervals?
Seçenekler
A
Nominal scale
B
interval scale
C
ordinal scale
D
ratio scale
E
qualitative scale
Açıklama:
Ordinal scales of measurement have the property of both classifying and magnitude. Subjects are categorized into different rank ordered groups. Each value on the ordinal scale has a unique meaning, and it has an ordered relationship to every other value on the scale.
Soru 24
- data is collected based on what is seen or heard
- researcher do not intervene to the subjects
- variables might be manipulated by the researcher
Which of the above is/are the characteristics of observational studies?
Seçenekler
A
Only I
B
Only III
C
I and II
D
I and III
E
II and III
Açıklama:
In an observational study, researchers simply collect data based on what is seen and heard and infer based on the data collected. Researchers observe subjects and measure variables of interest without any intervention to the subjects. Experimental study is a study in which the researcher manipulates some of the variables and try to determine how the manipulation influences other variables.
Soru 25
- the individuals included in the study might be aware of this
- observer must record the events correctly
- data could be obtained over an extended period of time
Seçenekler
A
Only I
B
Only III
C
I and II
D
I and III
E
II and III
Açıklama:
Data collection by observation procedure has some advantages and limitations. The advantages are:
1. The direct recording of the data avoids problems such as incomplete or distorted recall.
2. Data can be obtained continuously over an extended period of time.
The limitations are:
1. The observer or the instrument to be used for data gathering must be able to record the events correctly. For example, human observers must get through training about the study and the data to be collected and so that different observers will record the same events in the same manner.
2. The individuals included in the study might be aware of this fact and then altered their behavior, decision or answers. This leads to bias in the study.
Soru 26
What is the underlying reason of using closed-ended questions rather than open-ended question in many surveys?
Seçenekler
A
Gathering more detailed data
B
Obtaining higher response rates
C
Being easier to read
D
gathering more accurate data
E
Making responder think deeper
Açıklama:
In many surveys, closed-ended questions are preferred because close-ended questions lead to obtain higher response rates when responders don’t have to type so much.
Soru 27
Which of the following is generally used to measure the attitudes of individuals towards a subject?
Seçenekler
A
Open-ended questions
B
Multiple responses
C
Ranked responses
D
Rated responses
E
Ordered responses
Açıklama:
Likert type of scale is generally used to measure the attitudes of an individual towards a specific subject.
Soru 28
- Data set is large
- Measurements type is ratio scale
- Interpretation should be easier
Seçenekler
A
Only I
B
Only II
C
Only III
D
I and II
E
I and III
Açıklama:
When the data set is large or the measurements are obtained using ratio scale, grouped frequency is more appropriate for summarizing the data.
Soru 29
Which of the following is true about relative frequency distribution table?
Seçenekler
A
It could be easier or clearer to interpret the table when using percentage of the frequency
B
It provides information of how many observations occurred for each value
C
It is more appropriate to use when data set is too large
D
It is better to use if measurement is obtained using ratio scale
E
It is used to determine the number of elements that falls above or below a particular value
Açıklama:
Interpretation of the frequency distribution table can be easier or clearer when we use the percentage of the frequency.
Soru 30
Which of the following is true about cumulative frequency distribution table?
Seçenekler
A
It could be easier or clearer to interpret the table when using percentage of the frequency
B
It consists of classes and the number of elements in these classes
C
It is more appropriate to use when data set is too large
D
It is better to use if measurement is obtained using ratio scale
E
It can be used to determine the number of elements that falls above or below a particular value
Açıklama:
A frequency distribution table provides information of how many observation or elements occurred for each value or group of values of a variable. Cumulative frequency is used to determine the number of elements that falls above or below a particular value in a given class interval.
Soru 31
Which of the following is not an component of data sets?
Seçenekler
A
Element
B
Variable
C
Case
D
Observation
E
Analysis
Açıklama:
Analysis is not a component of data sets. Analysis can be done over datasets.
Soru 32
Which of the following is a nominal scale type data?
Seçenekler
A
Age
B
Height
C
Weight
D
Gender
E
Income
Açıklama:
Nominal scale classifies things into qualitative different classes. Gender is qualitative.
Soru 33
Which of the following scales have a natural or zero-valued base that cannot be changed?
Seçenekler
A
Ratio scale
B
Interval scale
C
Nominal scale
D
Ordinal scale
E
Cardinal scale
Açıklama:
That type is ratio scale. An example of this type scales is age. The age of a person can be zero at minimum. So if one person is 60 years old, he/she is 3 times older than a person who is 20 years old.
Soru 34
A researcher goes to a bus station and takes record of the number of people getting into a bus in that station everyday. Which type of data collection method is the researcher using?
Seçenekler
A
Interview
B
Observation
C
Self-Enumeration
D
Questionnaire
E
Sampling
Açıklama:
The researcher is making an observation.
Soru 35
"Which type of transportation vehicle do you use most often?
Answer:.............................................................."
Which type of questionnaire question is the one above?
Answer:.............................................................."
Which type of questionnaire question is the one above?
Seçenekler
A
Multiple Response
B
Single Response
C
Open-Ended
D
Closed-Ended
E
Ranked
Açıklama:
It's a open-ended question type because the respondent can freely answer whatever he thinks of. He doesn't choose among or rank the given options.
Soru 36
How can we determine whether respondents are interpreting questions as intended and whether the order of questions may influence responses?
Seçenekler
A
By conducting a pretest over a small sample of survey population.
B
By carefully reviewing the survey questionnaire.
C
By analyzing the results of the survey.
D
By discussing the questionnaire questions with an experienced statistician.
E
We can never determine this.
Açıklama:
A pretest over a small sample can help us in determining whether questions are clearly understood and whether the order of questions cause a difference in results.
Soru 37
An advertisement company conducts a survey on parfume preferences of adults in a city in which the half of the population is female. The researcher collects a sample of 200 people of whom 170 are male.
What type of error does the researcher make?
What type of error does the researcher make?
Seçenekler
A
Error in population spesification
B
Error in measurement
C
Error in sampling
D
Error in modelling
E
Error in analyzing
Açıklama:
Since almost half of the population is female, he is making a mistake in sampling. The parfume preferences of males and females could be different and his sample is male biased.
Soru 38
A researcher collects data about the weight of pupils in a school. There are 500 students in that school whose weight differs from 20kgs to 40kgs.
If this researcher wants to constitute a grouped frequency distribution table, what is the class width for this case?
If this researcher wants to constitute a grouped frequency distribution table, what is the class width for this case?
Seçenekler
A
0.04 kg
B
0.5kg
C
0.89 kg
D
1 kg
E
2 kg
Açıklama:
Class Width=Range/Number of classes
where Number of Classes=√n, where n=number of observations
Thus Number of Classes=√500=22.36
But when the number of classes is larger than 20 we take it as 20. So in this case:
Class Width=(40-20)/20=20/20=1kg
where Number of Classes=√n, where n=number of observations
Thus Number of Classes=√500=22.36
But when the number of classes is larger than 20 we take it as 20. So in this case:
Class Width=(40-20)/20=20/20=1kg
Soru 39
The number of workers in a certain factory is given below. What is the cumulative frequency of of workers whose age is less than 50?
Age Range | Frequency |
20-24 | 50 |
25-29 | 40 |
30-34 | 35 |
35-39 | 20 |
40-44 | 25 |
45-49 | 20 |
50-54 | 10 |
Seçenekler
A
0.65
B
0.675
C
0.775
D
0.8
E
0.95
Açıklama:
There are 200 workers in factory and in total 190 them are below 50 years old. Thus the cumulative frequency is 190/200=0.95 (95 %)
Soru 40
Which of the following terms stands for errors caused by unknown and unpredictable factors?
Seçenekler
A
Systematic error
B
Random error
C
Measurement error
D
Specification error
E
Sampling error
Açıklama:
The definition corresponds to random error. Random errors are caused by unknown and unpredictable factors that randomly affect measurement of the variable across the sample.
Soru 41
According to the data set given in the following table, what constitutes the case for John?
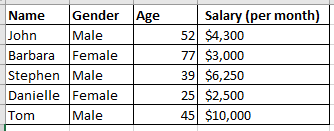
Seçenekler
A
Male
B
52, 4300
C
Female, 52
D
Male, 52, 4300
E
Male, 45, 10000
Açıklama:
The outcomes obtained on all variables for one element in the data set is called a case. In this table, the outcomes on the four variables for John constitutes a case. name,gender, age, salary= John, Male, 52, 4300
Soru 42
Which is TRUE about the table below specifying types of books a particular customer prefers?
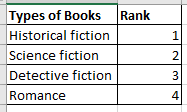
Seçenekler
A
It has the properties of classifying, magnitude, and equal intervals.
B
It has a natural or zero-valued base value that cannot be changed.
C
It is important that there is no any particular order or ranking for classes.
D
The consecutive categories do not represent equal differences of the measured attribute.
E
It is considered a nominal scale of measurement.
Açıklama:
Ordinal scales of measurement have the property of both classifying and magnitude. Subjects are categorized into different rank ordered groups. Each value on the ordinal scale has a unique meaning, and it has an ordered relationship to every other value on the scale. From the table, we can conclude that the customer prefers historical fiction to science fiction, science fiction to detective fiction, detective fiction to romance. However, even though the differences in the consecutive numbers of the ranks are equal, we cannot say that how much the customer prefers one type of book over another type. That is, consecutive categories do not represent equal differences of the measured attribute.
Soru 43
An English teacher wants to look into the effect of a certain teaching strategy on learning. Which is NOT TRUE about her study?
Seçenekler
A
The researcher will conduct an observational study.
B
The researcher will manipulate some of the variables.
C
The researcher will apply randomization techniques.
D
The researcher will record the effectiveness of the new strategy.
E
The researcher will have experimental and control groups.
Açıklama:
In observational studies, researchers observe subjects and measure variables of interest without any intervention to the subjects. In this case, the teacher wants to learn if the new strategy affects the learning. The researcher needs to manipulate some of the variables and try to determine how the manipulation influences other variables.
Soru 44
An employee is given a survey where he is given three options like "Agree", "Undecided", and "Disagree". What type of responses does he need to give?
Seçenekler
A
Close-ended responses
B
Ranked responses
C
Rated responses
D
Multiple responses
E
Single responses
Açıklama:
Rated responses generally include three-point, five-point, and seven-point scales. A rating scale should provide more than two options. The mostly used rating scale is five-point Likert (1932) type scale. Likert type scale can be designed in the following forms.
• Strongly Agree - Agree - Undecided / Neutral - Disagree - Strongly Disagree
• Always - Often - Sometimes - Seldom - Never
• Extremely - Very - Moderately - Slightly - Not at all
• Excellent - Above Average - Average - Below Average - Very Poor
• Strongly Agree - Agree - Undecided / Neutral - Disagree - Strongly Disagree
• Always - Often - Sometimes - Seldom - Never
• Extremely - Very - Moderately - Slightly - Not at all
• Excellent - Above Average - Average - Below Average - Very Poor
Soru 45
Which one is TRUE about error in sampling?
Seçenekler
A
It occurs when the researcher determines an inappropriate population from which to collect data.
B
It can be described as any discrepancy between the actual result obtained and
the correct result that would be provided by an ideal procedure.
the correct result that would be provided by an ideal procedure.
C
It is caused by unknown and unpredictable factors that randomly affect measurement
of the variable across the sample.
of the variable across the sample.
D
It arises from problematic, poor calibrated or incorrectly used equipment.
E
It arises from not representing the targeted population and the results yield biased or inaccurate information.
Açıklama:
Sample in statistics means a small part of the targeted population. A sample must be representative of the population. Sampling methods must be used to achieve a representative sampling. Otherwise, the sampling does not represent the targeted population and the results yield biased or inaccurate information.
Error in population specification occurs when the researcher determines an inappropriate population from which to collect data.
Error in measurement can be described as any discrepancy between the actual result obtained and the correct result that would be provided by an ideal procedure. From a statistical point of view any observation is composed of the true value plus some random error value. However, all error is not random. The error component of any observation can be divided into two subcomponents, random error and systematic error.
Random errors are caused by unknown and unpredictable factors that randomly affect measurement of the variable across the sample. For example, a school teacher conducted a particular survey on the students to measure their performances. Some students may be feeling in a good mood and others may be depressed. This may artificially deflate performance scores of the depressed students. Random error does not have any consistent effects across the entire sample. Instead, it affects observed scores up or down randomly. Random error adds variability to the data and it is sometimes called noise.
Systematic errors are reproducible inaccuracies that shift measurements from their true value by the same amount and consistently in the same direction. This type error arises from problematic, poor calibrated or incorrectly used equipment. For example, an industrial scale showed heavier weights than it should be for a particular product because it was not calibrated properly and thereby provided incorrect measurements.
Soru 46
Customers asked to respond to the following statement. “The picture quality of your TV is satisfactory”. Customers responded to the statement as 1=Strongly Disagree, 2=Disagree, 3=Undecided, 4=Agree, and 5=Strongly Agree.
If the measurement categories and the number of responses within a given measurement category are used, what method of data organization is implemented in the case specified above?
If the measurement categories and the number of responses within a given measurement category are used, what method of data organization is implemented in the case specified above?
Seçenekler
A
Raw data
B
Grouped Frequency Distribution Table
C
Frequency Distribution Table
D
Cumulative Frequency Distribution Table
E
Relative Frequency Distribution Table
Açıklama:
Sometimes raw data in a frequency distribution table yield more useful information. To construct a frequency distribution table, the measurement categories and the number of responses within a given measurement category are used.
Soru 47
There are 85 people interviewed on their weekly salary. If the frequency for Class 2 is 21 what is the percentage of relative frequency?
Seçenekler
A
0,247
B
24,7
C
21,3
D
2,13
E
0,85
Açıklama:
Interpretation of the frequency distribution table can be easier or clearer when we use the percentage of the frequency. Percentage representation of frequency can also be displayed in the frequency distribution table. Percentage of frequency is called the relative frequency and the table is called relative frequency distribution table. Relative frequency can be used for both quantitative and qualitative variables. The relative frequency for a class is calculated as follows: Relative Frequency = fi/ n where, fi is the frequency for class i and n is the sample size. In this case, fi is 21and n is 85. The percentage of relative frequency is 24,7.
Soru 48
In a salary data example, the frequency table shows that there are 20 workers of whose weekly salaries are between 415 and 525 dollars. Which of the below should we use if we need to know, for example, how many workers earn under 525 dollars?
Seçenekler
A
Class Interval
B
Frequency
C
Cumulative Relative Frequency
D
Cumulative Frequency
E
The Percentage of Cumulative Relative Frequency
Açıklama:
We can obtain such information by using cumulative frequency. Cumulative frequency is used to determine the number of elements that falls above or below a particular value in a given class interval. The cumulative frequency of a class is calculated by adding its frequency to the sum of all predecessor class frequencies. Consequently, the last value must be equal to the sample size.
Soru 49
Which is NOT TRUE about the table below?
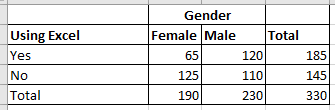
Seçenekler
A
There are three categorical variables.
B
It is a contingency table of the variables gender and excel knowledge.
C
We may conclude that number of males who have technical knowledge is greater than those in female.
D
It is used to determine if one categorical variable is related to another categorical variable.
E
It excludes relative frequencies or percentages.
Açıklama:
In this table, there are two categorical variables. One is the variable gender which has two categories, female and male. The other categorical variable is the variable excel knowledge which has two categories, yes and no. Thus, there are two categorical variables.
Ifa data set includes two different categorical variables, we use a two-way table (contingency table) todemonstrate the relationship and interaction of the two categorical variables. A two-way table of counts organizes data about two categorical variables measured from the same set of individuals. A contingency table is a special type of frequency distribution table, where two variables are shown simultaneously and
it is used to determine if one categorical variable is related to another categorical variable.
Soru 50
According to the contingency table below, what are the percentage of male and female respectively within the people who do not have technical knowledge (No)?
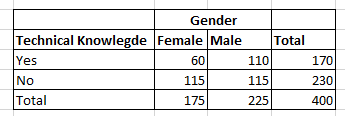
Seçenekler
A
75%, 25%
B
35%, 65%
C
50%, 50%
D
40%, 60%
E
20%, 80%
Açıklama:
When we create the contingency table with row and column percentages, within the people who do not have technical knowledge (No) the percentage of male and female are 50% and 50%, respectively.
Soru 51
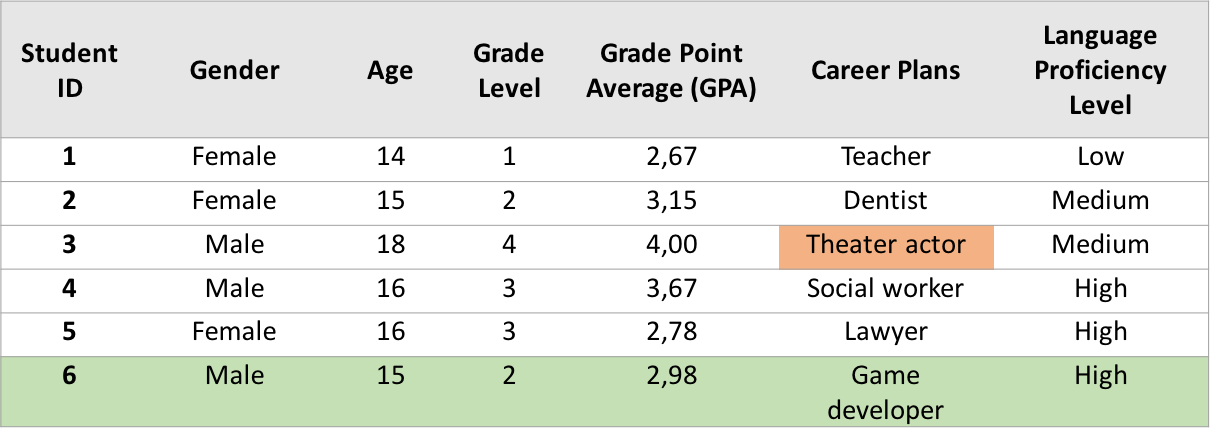 What are the gray, orange and green highlighted places in the dataset table above, called respectively?
Seçenekler
A
Case-Element-Variable
B
Observation-Case-Data
C
Data-Variable-Element
D
Variable-Observation-Case
E
Element-Case-Variable
Açıklama:
The statements given in the first row of the table show the variables in the data set. Variable is a characteristic, number, or quantity that increases or decreases over time, or takes different values in different situations (e.g. income, age, weight, etc., and “occupation”, “industry”, “disease”, etc.).
The outcome about a single variable for an element in the data set is called an observation.
The outcomes obtained on all variables for one element in the data set is called a case. Sometimes a case is defined as a record or observation vector.
Variable-Observation-Case
The outcome about a single variable for an element in the data set is called an observation.
The outcomes obtained on all variables for one element in the data set is called a case. Sometimes a case is defined as a record or observation vector.
Variable-Observation-Case
Soru 52
 Self-reported data for high school students is presented in the table above. In which of the following correctly refers to the measurement levels of the variables "career plans and age"?
Seçenekler
A
Career Plans: Nominal scale
Age: Ratio scale
Age: Ratio scale
B
Career Plans: Interval scale
Age: Interval scale
Age: Interval scale
C
Career Plans: Ordinal scale
Age: Interval scale
Age: Interval scale
D
Career Plans: Ordinal scale
Age: Ratio scale
Age: Ratio scale
E
Career Plans: Nominal scale
Age: Ordinal scale
Age: Ordinal scale
Açıklama:
Nominal variables are used to “name,” or label a series of values.
Ordinal scales provide good information about the order of choices, such as in a customer satisfaction survey.
Interval scales give us the order of values and the ability to quantify the difference between each one.
Ratio scales give us the ultimate-order, interval values, plus the ability to calculate ratios since a “true zero” can be defined.
Career Plans: Nominal scale
Age: Ratio scale
Soru 53
Self-reported data for high school students is presented in the table above. How many interval scales are there in the data set above?Seçenekler
A
None
B
1
C
2
D
3
E
4
Açıklama:
Only grade point average (GPA) refers to a variable on interval scale. Gender and career plans are nominal variables, grade level and language proficiency level are on ordinal scale, and age is on ratio scale.
1
1
Soru 54
Self-reported data for high school students is presented in the table above.How many ordinal variables are in the dataset table above?
Seçenekler
A
None
B
1
C
2
D
3
E
4
Açıklama:
Grade level and language proficiency level are on ordinal scale. Grade point average (GPA) refers to a variable on interval scale, gender and career plans are nominal variables, and age is ratio type variable.
2
2
Soru 55
What are dependent (DV) and independent (IV) variables in a study to determine whether how long a student sleeps, studies, and solves the number of questions affects exam scores?
Seçenekler
A
DV: Exam score and the length of time spent sleeping
IV: Number of questions solved
IV: Number of questions solved
B
DV:The length of time spent studying
IV: Exam score, number of questions solved
IV: Exam score, number of questions solved
C
DV: Exam score
IV: Number of questions solved, the length of time spent sleeping, and studying
IV: Number of questions solved, the length of time spent sleeping, and studying
D
DV:The length of time spent studying and number of questions solved
IV: Exam score
IV: Exam score
E
DV:Number of questions solved, the length of time spent sleeping
IV: The length of time spent studying and exam score
IV: The length of time spent studying and exam score
Açıklama:
Independent variables are controlled inputs. Dependent variables represent the output or outcome resulting altering these inputs. In other words, you can consider the independent variable as the cause and the dependent variable as the effect.
The independent variable s are the length of time spent sleeping, studying and the number of questions solved while the dependent variable is the exam score.
The independent variable s are the length of time spent sleeping, studying and the number of questions solved while the dependent variable is the exam score.
Soru 56
Researchers collected data from 100 men aged 40 of whom 50 have been smoking a pack of cigarettes a day for 5 years while the other 50 have been smoke free for 5 years. They measured their lung capacity for each of the 100 men, analyzed, and drawn conclusions from the collected data. According to the study described above, what type of study is it?
Seçenekler
A
True-experimental study
B
Quasi-experimental study
C
Longitudinal study
D
Observational study
E
Correlational study
Açıklama:
This study refers to an observational study in which researchers observe subjects (participants) and measure variables of interest without assigning treatments to the subjects. The treatment that each subject receives is determined beyond the control of the investigator.
Soru 57
Researchers wanted to evaluate the effectiveness of eKampüs Anadolum system at the end of the semester with a questionnaire. In this questionnaire, students were asked to indicate how often they used the system by marking on the following scale:
(1) none
(2) 1-2 times in the semester
(3) 1-2 times per month
(4) 1-2 times per week
(5) Every day
According to the description given above, what type of question is this?
(1) none
(2) 1-2 times in the semester
(3) 1-2 times per month
(4) 1-2 times per week
(5) Every day
According to the description given above, what type of question is this?
Seçenekler
A
Open-ended
B
Ranked responses
C
Multiple responses
D
Rated Responses
E
Single response
Açıklama:
Rated responses generally include three-point, five-point, and seven-point scales. A rating scale should provide more than two options. The mostly used rating scale is five-point Likert (1932) type scale.
Soru 58
Suppose that researchers collected a random sample of 2500 people from the general Turkish adult population to gauge their entertainment preferences. Then, upon analysis, found it to be composed of 75% males.
What type of error was made if this sample would not be representative of the general adult population and would influence the data?
What type of error was made if this sample would not be representative of the general adult population and would influence the data?
Seçenekler
A
Measurement error
B
Nonresponse error
C
Population specification
D
Analysis error
E
Sampling error
Açıklama:
Sampling error is affected by the homogeneity of the population being studied and sampled from and by the size of the sample. In the Turkish population, the female to male ratios are almost equal. In order to avoid this error you can increase the size of your sample so you get more survey participants.
Soru 59
The frequency distribution of the students’ weights was constructed as the following table. Consider the grouped data table, what is the ratio of the students whose weights are above 65?
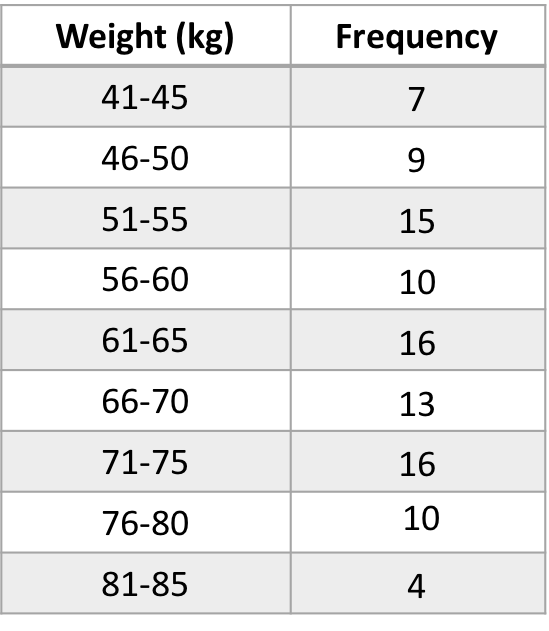
Seçenekler
A
0,30
B
0,37
C
0,43
D
0,49
E
0,52
Açıklama:
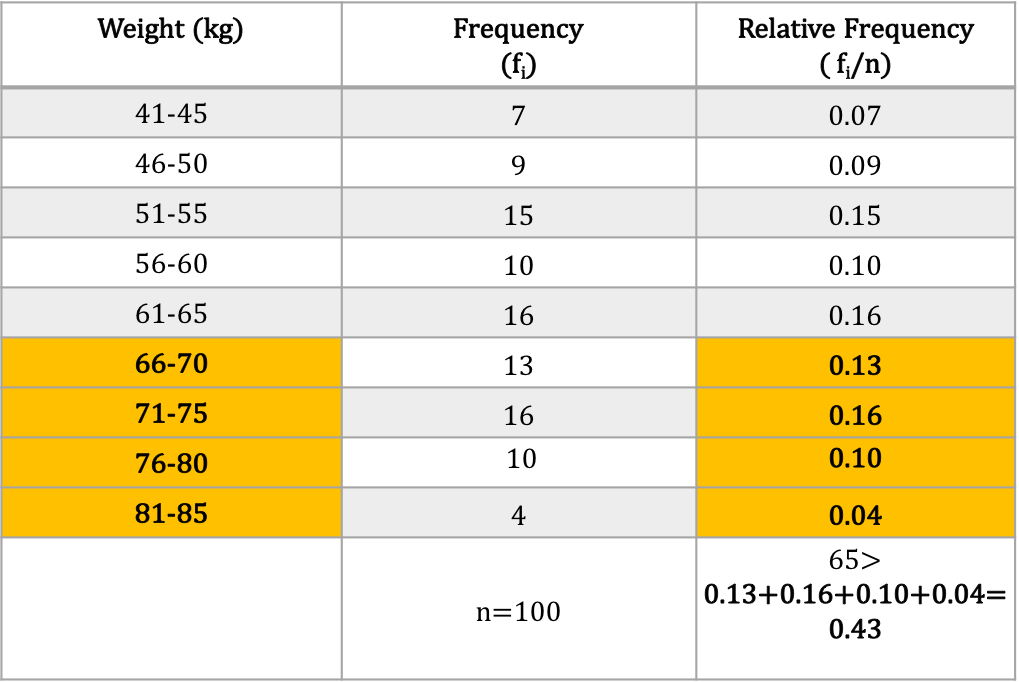
0,43
Soru 60
The contingency table constructed between the smoking status and age of the participants is as follows.
Within the non-smokers, what is the percentage of participants under 30?

Within the non-smokers, what is the percentage of participants under 30?
Seçenekler
A
20%
B
30%
C
40%
D
50%
E
60%
Açıklama:
Non-smokers under 30= 20 people
Non-smokers 30 & over= 30 people
Total non-mokers: 20+30=50
Within smokers, (20x100)/50= 40% age under 30 years.
(30x100)/50= 60% age <30 years.
40% under 30 years old.
60% of them 30 & over.
Non-smokers 30 & over= 30 people
Total non-mokers: 20+30=50
Within smokers, (20x100)/50= 40% age under 30 years.
(30x100)/50= 60% age <30 years.
40% under 30 years old.
60% of them 30 & over.
Ünite 3
Soru 1
 The graphic above shows the frequency distribution of five continents being visited by 15 people.
What kind of a graphic is used to show the frequency distribution in the figure above?
Seçenekler
A
Pie chart
B
Line chart
C
Scatter plot
D
Bar Chart
E
Dot plot
Açıklama:
The pie chart of the continent data is shown in the figure above. As it can be seen from the figure, each slice of pie chart corresponds to a continent, showing a percentage of people who travelled to this continent.The figure 3.13a illustrates each slice coloured differently in a two dimensional space. The correct option is A.
Soru 2
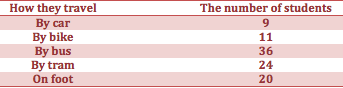 Suppose that 100 students were asked what type of transportation they use to travel home. Using the student responses given in the table below, construct the pie chart of this data. Which of the response do you think take the smallest portion?
Seçenekler
A
By car
B
By bike
C
By bus
D
By tram
E
On foot
Açıklama:
The number of students who travel home by car is the smallest so travelling by car will have the smallest portion on the pie chart. The correct answer is A.
Soru 3
"It is almost the easiest of the graphs. It can be drawn by hand easily while collecting data. It will be very useful when the number of objects in our study is rather small such as up to 50 observations. It is generally used to investigate univariate (quantitative) data, but sometimes it is used to compare two variables. Essentially it is a one-dimensional scatterplot of observed values of a variable." Which type of graphic is described in the paragraph above?
Seçenekler
A
Pie chart
B
Line chart
C
Dot plot
D
Histogram
E
Bar chart
Açıklama:
Dot plot is almost the easiest of the graphs. It can be drawn by hand easily while collecting data. Dot plot will be very useful when the number of objects in our study is rather small such as up to 50 observations. Dot plot is generally used to investigate univariate (quantitative) data, but sometimes it is used to compare two variables. Essentially a dot plot is a one-dimensional scatterplot of observed values of a variable. The correct answer is C.
Soru 4
Which pie chart is the correct one to analyze the data presented in the table below?
Seçenekler
A 
B 
C 
D 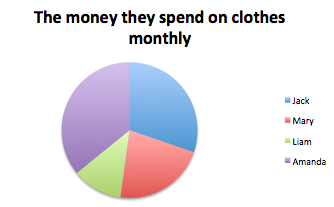
E 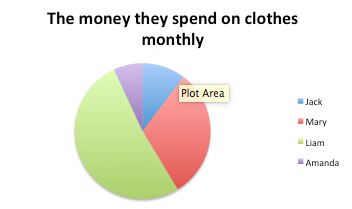
Açıklama:
According to the table, Amanda gets the largest and Liam gets the smallest portion. Therefore, the correct answer is D.
Soru 5
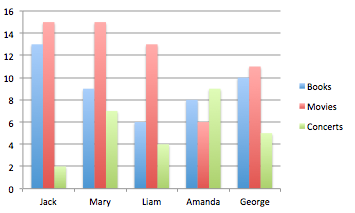 In the graphic above, the number of activities each student did is presented. What kind of a graphic is used to present this data?
Seçenekler
A
Line chart
B
Grouped bar chart
C
Histogram
D
Stacked bar chart
E
Steam and leaf display
Açıklama:
The information about several subgroups of each category can be shown by a grouped bar chart. It can be plotted in horizontal or vertical directions similar to simple bar chart. In grouped bar chart, for each main category there are different sub-categories. In this chart the main categories are the names of the students and the subcategories are the activity types. The correct answer is B.
Soru 6
In the graphic above, the number of activities that five students did during a semester is present in a grouped bar chart. According to this data, which student attended the most concerts?Seçenekler
A
Jack
B
Mary
C
Liam
D
Amanda
E
George
Açıklama:
The number of concerts that the students attended is shown by the color green. Amanda has the highest green bar. The correct answer is D.
Soru 7
Which of the following is FALSE about histogram ?
Seçenekler
A
It is very similar to a bar chart.
B
It shows continuous data.
C
It is drawn for qualitative data.
D
It can tell about the peaks and extreme values.
E
It helps us to identifty the symmetry of the data.
Açıklama:
Histogram is a graph that is very similar to a bar chart except that bar charts are drawn for qualitative data but histograms are drawn for continuous data. The correct answer is C.
Soru 8
"It is often used to display the trends in a continuous data over a period of time. It also works well with discrete (ordered) or categorical types of data. It is constructed by intersecting the points by lines on the x-axis. Some of them are used to draw in two or three dimensions. Additionally, some of them are very helpful to show the relationships for multivariate data."
What kind of a graphic is described in the paragraph above?
What kind of a graphic is described in the paragraph above?
Seçenekler
A
Bar chart
B
Pie chart
C
Histogram
D
Dot plot
E
Line chart
Açıklama:
Line chart is often used to display the trends in a continuous data over a period of time. Line chart also works well with discrete (ordered) or categorical types of data. The chart is constructed by intersecting the points by lines on the x-axis. Some line charts are used to draw in two or three dimensions. Additionally, some of the line charts are very helpful to show the relationships for multivariate data.The correct answer is E.
Soru 9
What type of a graphic is used to investigate the relationship between two variables?
Seçenekler
A
Dot plot
B
Pie chart
C
Histogram
D
Scatter plot
E
Line chart
Açıklama:
Scatter plot is used to investigate the relationship between two variables. They are also very helpful indicating the minimum, maximum or outliers of the variables.The correct answer is D.
Soru 10
I. the shape of the distribution of the data
II.the relation between two sets of data
III.the most repeating observations
Which of the things above a properly created graph can report in a visual form?
II.the relation between two sets of data
III.the most repeating observations
Which of the things above a properly created graph can report in a visual form?
Seçenekler
A
I
B
I and II
C
II
D
II and III
E
I, II and III
Açıklama:
A properly created graph can report various information of the data in a visual form. For instance, the shape of the distribution of the data, the relation between two sets of data, the most repeating observations, outliers, peaks, summary statistics (minimum, maximum, range, mean, median) etc. can be identified from graphics. The correct answer is E.
Soru 11
Which of the following is not true about the dot plot?
Seçenekler
A
A dot plot is a one-dimensional scatterplot of observed values of a variable.
B
In order to create a dot plot one needs to identify the lowest and the highest value of the data set.
C
If there are repeating observations (multiple occurrences), the dots are stacked up vertically.
D
Dot plots tend to be useful to determine a vague point for location of center.
E
Dot plot will be very useful when working with large number of observations.
Açıklama:
Dot plot will be very useful when the number of objects in our study is rather small such as up to 50 observations. It is especially easy to identify the distribution of a set of data from a dot plot for small and moderate sample sizes. A dot plot is generally not useful for large sizes of data as it may not be possible to display all of the individual values with large datasets.
Soru 12
Which of the following is not true about stem and leaf display?
Seçenekler
A
A stem-and-leaf display was invented by Tukey (1977) as a method of displaying data.
B
A stem-and-leaf display is a type of graph for listing the numerical data.
C
A steam and leaf display doesn't give information about the grouped frequency distribution of the data.
D
A stem and leaf display is useful for assessing the location and spread of the distribution of the data.
E
A stem and leaf display can be useful to figure out the range, outliers, the most frequent values and the shape of the data.
Açıklama:
One of the important advantages of the stem-and-leaf display is that it gives the researcher a chance to create a grouped frequency distribution of the data without using any formula.
Soru 13
Which of the following is not correct about bar charts?
Seçenekler
A
The information about several subgroups of each category can be also shown by a grouped bar chart.
B
A bar chart is the graphical representation of frequencies by rectangles (or bars) with lengths (or heights) proportional to the frequencies of observations.
C
A simple bar chart is used to represent continuous values for each category.
D
A stacked bar chart is a bar chart where each bar is divided into subgroups proportional to the contribution a subgroup makes to an associated bar.
E
Bar graphs are typically used to compare counts, frequencies, the number of categories, objectives, amounts.
Açıklama:
Simple bar chart is used to represent discrete values for each category for a given variable on x-axis (horizontal).
Soru 14
Which of the following is not true about histogram?
Seçenekler
A
A histogram is drawn for continuous data.
B
In order to draw the histogram of the data, a large sample is needed.
C
A histogram gives information about the centre, shape and symmetry of the data.
D
A histogram can also be used to check out the normality.
E
A histogram doesn't give information about the peaks and extreme values.
Açıklama:
Histograms will help us to identify the centre, shape and symmetry of the data. A histogram can tell us about the peaks and extreme values..
Soru 15
Which of the following is not true about the pie chart?
Seçenekler
A
A pie chart is usually used for categorical
data.
data.
B
In the pie chart components or outcomes of a total frequency is shown as sectors of a circle.
C
In the pie chart, the categories are divided into slices/sectors.
D
A pie chart usually shows the actual values.
E
The drawing of a pie chart involves the calculation of angles for each slice/sector.
Açıklama:
A pie chart usually does not show the actual values, therefore, it may easily become a misleading chart.
Soru 16
Which of the following can be used to display the trends in continuous data over a period of time?
Seçenekler
A
Pie chart
B
Line chart
C
Frequency polygon
D
Bar chart
E
Stem and leaf display
Açıklama:
Line chart is often used to display the trends in a continuous data over a period of time. Line chart also works well with discrete (ordered) or categorical types of data.
Soru 17
Which of the following is used to investigate the relationship between two variables?
Seçenekler
A
Scatter plot
B
Lina chart
C
Bar chart
D
Histogram
E
Pie chart
Açıklama:
A scatter plot is used to investigate the relationship between two variables. They are also very helpful indicating the minimum, maximum or outliers of the variables. One of the reasons that the scatter plots may be drawn is that the scatter plot gives a good indication of the correlation between two variables.
Soru 18
Which of the following is more useful to discover the overall shape of the data?
Seçenekler
A
Pie chart
B
Histogram
C
Dot plot
D
Line chart
E
Frequency polygon
Açıklama:
The frequency polygons are useful to discover the overall shape of the data (Is it symmetric or is there any asymmetry?). In order to create the frequency polygon, we use the midpoints of the bins (classes) in histogram vs the frequency of each bin. The midpoints are marked by a dot within each class interval. A straight line is used to connect the dots and so that lines are connected to each other.
Soru 19
In which of the following components and outcomes of a total frequency is shown as sectors of a circle?
Seçenekler
A
Line chart
B
Pie chart
C
Bar chart
D
Histogram
E
Scattered plot
Açıklama:
A pie chart is usually used for categorical data. In pie chart components or outcomes of a total frequency is shown as sectors of a circle. The shape resembles a pie, hence the name of the chart.
Soru 20
Which of the following is not true about the scatter plot?
Seçenekler
A
Scatter plot is used to investigate the change of a variable over a time.
B
To construct a scatter plot, two data sets or variables are needed, usually, these two data sets or variables are named as X and Y.
C
The pair of the data point for a specific observation, (X, Y), is represented by a dot or a symbol of convenience.
D
Scatter plot gives a good indication of the correlation between two variables.
E
Scatter plot is a good indicator of the value of the correlation coefficient.
Açıklama:
Scatter plot is used to investigate the relationship between two variables. They are also very helpful indicating the minimum, maximum or outliers of the variables.
Soru 21
What type of data presentation method is described in the sentences below?
- It is useful to determine a vague point for location of center and spread of data.
- It is not useful for large sizes of data.
To use this type of plot, one needs to identify the lowest and the highest value of the data set first.
Seçenekler
A
Dot Plot
B
Bar Chart
C
Scatter Plot
D
Histogram
E
Pie Chart
Açıklama:
Dot plot is almost the easiest of the graphs. It can be drawn by hand easily while collecting data. Dot plot will be very useful when the number of objects in our study is rather small such as up to 50 observations. Dot plot is generally used to investigate univariate (quantitative) data, but sometimes it is used to compare two variables. Essentially a dot plot is a one-dimensional scatterplot of observed values of a variable. In order to create a dot plot one needs to identify the lowest and the highest value of the data set first, then a horizontal axis is drawn and scaled so that it covers the lowest and highest values.
Soru 22
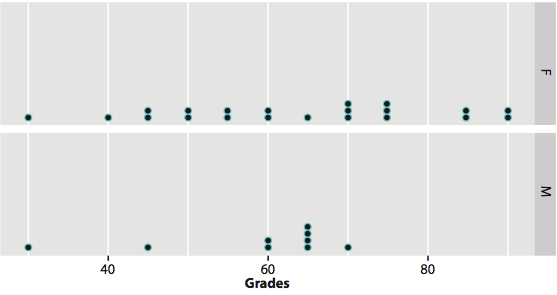
The figure above is a dot plot showing Mathematics grades in class A by gender. Which of the statements is not correct depending on the information above?
Seçenekler
A
The highest grade of males is 70.
B
The highest grade of females is 90.
C
There are more female students than the male students in class A.
D
There are groupings around 60 and 70 in male students.
E
There are groupings around 60 and 75 in female students.
Açıklama:
There are 3 female students who got 70 and 3 who got 75, which is the highest number of females around these grades.
Soru 23
Which one below gives us the difference between Dot plot and Stem-and-Leaf Display?
Seçenekler
A
A stem-and-leaf display is a type of graph for listing the numerical data.
B
In stem-and-leaf display the original numbers are kept.
C
Stem-and-leaf display are drawn for continuous data.
D
Stem-and-leaf display is usually used for categorical
data.
data.
E
Stem-and-leaf is often used to display the trends in a continuous data over a period of time
Açıklama:
A stem-and-leaf display is a type of graph for listing the numerical data and very similar to dot plot. If you remember in dot plot, dots are used to represent the each observation in our data. In stem-and-leaf display the original numbers are kept and a visual representation of data is created.
A pie chart is usually used for categorical data. Line chart is often used to display the trends in a continuous data over a period of time.
A pie chart is usually used for categorical data. Line chart is often used to display the trends in a continuous data over a period of time.
Soru 24
“It gives the researcher a chance to create a grouped frequency distribution of the data without using any formula”
Which of the data presentation visual is mentioned in this sentence?
Which of the data presentation visual is mentioned in this sentence?
Seçenekler
A
Dot Plot
B
Histogram
C
Pie Chart
D
Stem-And-Leaf Display
E
Scatter Plot
Açıklama:
One advantage of the stem-and-leaf display is that it gives the researcher a chance to create a grouped frequency distribution of the data without using any formula.
Soru 25
Which one below is a type of bar chart where each bar is divided into subgroups proportional to the contribution a subgroup makes to associated bar?
Seçenekler
A
Grouped Bar Chart
B
Stacked Bar Chart
C
Simple Bar Chart
D
Horizontal Bar chart
E
Vertical Bar Chart
Açıklama:
The stacked bar chart is a bar chart where each bar is divided into subgroups proportional to the contribution a subgroup makes to associated bar.
Soru 26
Which one below is NOT correct about histograms?
Seçenekler
A
Histograms will help us to identify the center, shape and symmetry of the data.
B
A histogram can tell us about the peaks and extreme values.
C
A histogram can be used to check out the normality.
D
You can think histograms as bar plots of grouped frequency distributions.
E
Histograms are drawn for qualitative data but not for continuous data.
Açıklama:
Histogram is a graph that is very similar to a bar chart except that bar charts are drawn for qualitative data but histograms are drawn for continuous data. Histograms will help us to identify the center, shape and symmetry of the data. A histogram can tell us about the peaks and extreme values, whether the distribution of data is skewed to the left, skewed to the right, bell-shaped, uniform or bimodal. A histogram can also be used to check out the normality.
Soru 27
An investor needs to decide on that the power of Turkish Lira to make an investment in Turkey and wants to analyze the tendency of Turkish Lira versus a foreign currency. Which type of display is best for the investor?
Seçenekler
A
A simple line chart
B
Pie chart
C
Histogram
D
Stem-And-Leaf Display
E
Scatter Plot
Açıklama:
In economics, the tendency of a foreign currency versus Turkish Lira may also be analyzed by a simple line chart, which may show a long term increase in the value of Turkish Lira against the foreign currency of interest. Therefore, an investor may decide that the power of Turkish Lira is increasing and it is high time to make an investment in Turkey.
Soru 28
Which type of plot is used to display the relationship between two sets of variables or to make comparisons between two sets of data points?
Seçenekler
A
Line chart
B
Pie chart
C
Histogram
D
Stem-And-Leaf Display
E
Scatter Plot
Açıklama:
Scatter plot is used to investigate the relationship between two variables. They are also very helpful indicating the minimum, maximum or outliers of the variables. One of the reasons that the scatter plots may be drawn is that scatter plot gives a good indication about the correlation between two variables.
Soru 29
The chart below shows the relation between humidity and temperature for a certain period of time. What type of relationship is there between temperature and humidity on the days the data recorded according to this chart?
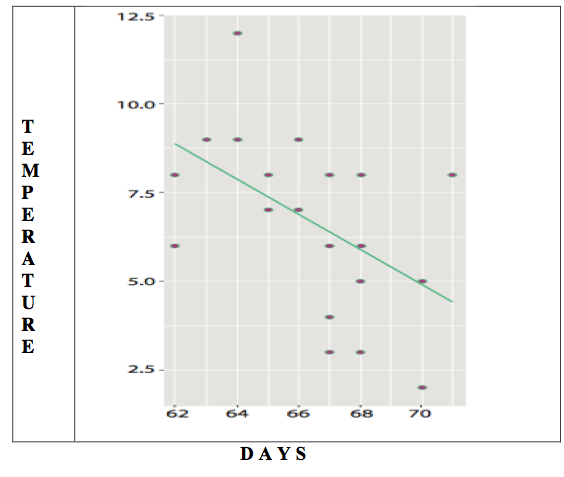
Seçenekler
A
Both the humidity and temperature are increasing.
B
Both the humidity and temperature are decreasing.
C
While the temperature is decreasing and humidity is increasing.
D
There is a positive correlation between humidity and temperature.
E
There is no correlation between humidity and temperature.
Açıklama:
In this figure, the scattered data points indicate a negative correlation between two sets of data, here the values of y-axis are decreasing but as it decrease the values of the y-axis variable increases.
Soru 30
The chart below shows the relationship between humidity and temperature for 25 days. Which option is correct depending on the information on the chart?
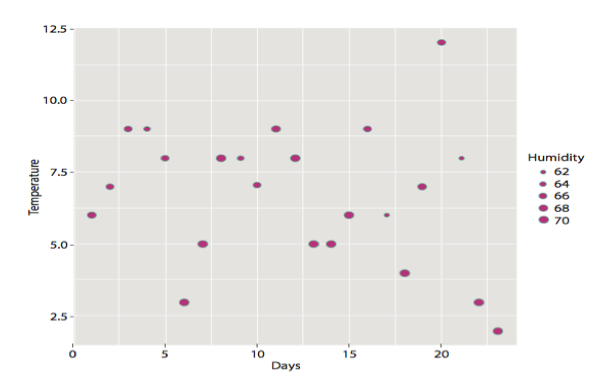
Seçenekler
A
The higher the temperature, the higher the humidity.
B
The days with low humidity levels never have temperatures above 5 C degrees.
C
The highest humidity levels are at temperatures above 10 C degrees.
D
Total humidity levels for 25 days is the highest at temperatures between 0 C degrees and 2,5 C degrees.
E
The days with high humidity tend to have temperatures at 2 C degrees, 5 C degrees and 8 C degrees.
Açıklama:
This pattern indicates that the days with high humidity tend to have temperatures at 2 C degrees, 5 C degrees and 8 C degrees.
Soru 31
- The relation between two sets of data
- The most repeating observations
- Summary statistics (min, max, mean, median etc.)
Seçenekler
A
Only III
B
I and II
C
I and III
D
II and III
E
I, II and III
Açıklama:
A properly created graph can report various information of the data in a visual form. For instance, the shape of the distribution of the data, the relation between two sets of data, the most repeating observations, outliers, peaks, summary statistics (minimum, maximum, range, mean, median) etc. can be identified from graphics.
Soru 32
- Can be drawn by hand easily while collecting data
- Useful when observation count is less than 50
- Generally used to investigate univariate data
Seçenekler
A
Dot plot
B
Stem-and-Leaf
C
Bar chart
D
Histogram
E
Pie chart
Açıklama:
Dot plot is almost the easiest of the graphs. It can be drawn by hand easily while collecting data.
Dot plot will be very useful when the number of objects in our study is rather small such as up to 50
observations. Dot plot is generally used to investigate univariate (quantitative) data, but sometimes it is
used to compare two variables.
Dot plot will be very useful when the number of objects in our study is rather small such as up to 50
observations. Dot plot is generally used to investigate univariate (quantitative) data, but sometimes it is
used to compare two variables.
Soru 33
Which of the following is not true for dot plots?
Seçenekler
A
Before creating a dot plot, lowest and highest values should be identified first
B
It is a simple chart that keeps each observation as a dot along horizontal axis
C
Repeating occurrences are represented as dots along horizontal axis
D
The data itself is kept within the graph so, its value could easily be identified by looking at the graph
E
It helps the researcher to quickly order the data
Açıklama:
In order to create a dot plot one needs to identify the lowest and the highest value of the data set first, then a horizontal axis is drawn and scaled so that it covers the lowest and highest values. A dot plot, essentially, is a simple chart where each observation is presented by a dot along the horizontal axis. If there are repeating observations (multiple occurrences), the dots are stacked up vertically. The dot plots will produce a simple graph of data but at the same time the data itself is never lost, you can easily identify the value of any data point in the dot plot. This is the most powerful aspect of the dot plots. It allows the researcher to show the data in a pictorial form without losing the original information/data. It also gives an opportunity to the researcher to quickly order the data.
Soru 34
- Divides values as greatest digits and remaining digits
- Useful to visualize the range, outliers and most frequent values
- Useful to assess the spread of the distribution of the data
Seçenekler
A
Dot plot
B
Stem-and-leaf
C
Bar chart
D
Pie chart
E
Histogram
Açıklama:
In stem-and-leaf display the original numbers are kept and a visual representation of data is created. Basically, stem-and-leaf display divides the values into a stem and leaf using a vertical line. The “stem” represents the greatest digits on the left of the line where the right of this line displays the “leaf ” with the remaining digits. This graph can be useful to figure out the range, outliers, the most frequent values and the shape of the data. It is also useful for assessing the location and spread of the distribution of the data.
Soru 35
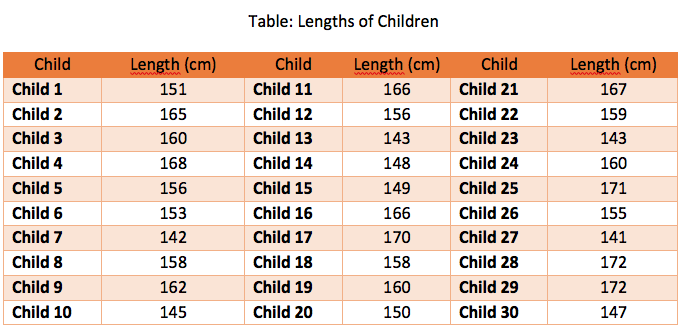
Which one of the following stem-and-leaf plot represents the data displayed in the Table above?
Seçenekler
A
B 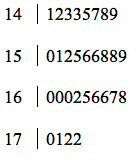
C 
D 
E 
Açıklama:
If you want to create a stem-and-leaf display of this data, you need to decide what the stem should be, it is easy to see that all these numbers are the multiples of ten, so the numbers should be 14, 15, 16, and 17. Stems and the leaves should be ordered on each stem from smallest to largest. A vertical line/axis is drawn and on the left hand side of the line/axis stem values are shown as a new row, next we start putting each observation to the right hand side of vertical line according to trailing digits. At last step in each row, the numbers on the right hand side is ordered. Thus the stem-and-leaf plot should be
Soru 36
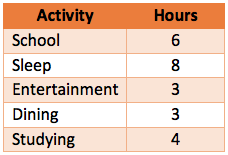
Choose the appropriate bar chart for the given frequency table?
Seçenekler
A 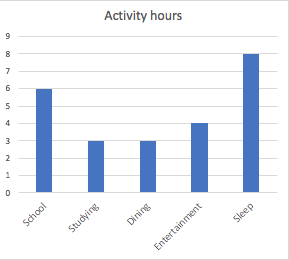
B 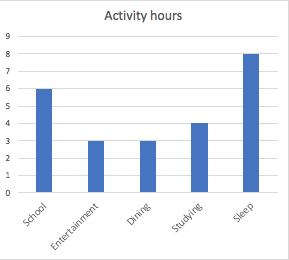
C 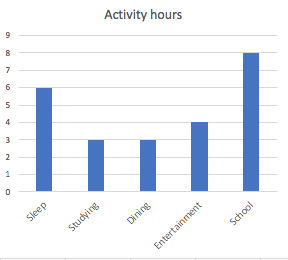
D 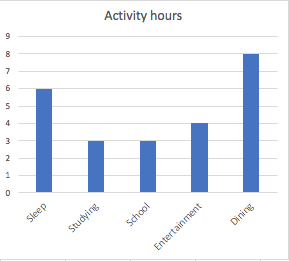
E 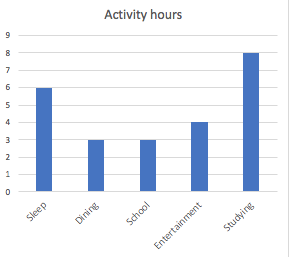
Açıklama:
Simple bar chart is used to represent discrete values for each category for a given variable on x-axis (horizontal). The y-axis (vertical) shows the actual numbers that are the bar heights for the corresponding category. Thus, the graph should be;
Soru 37
Choose the appropriate pie chart for the bar graph above?
Seçenekler
A 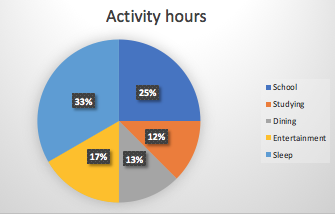
B 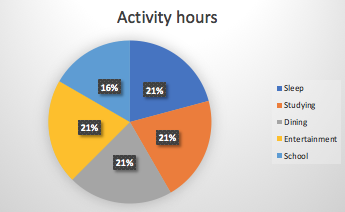
C 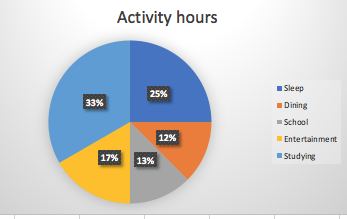
D 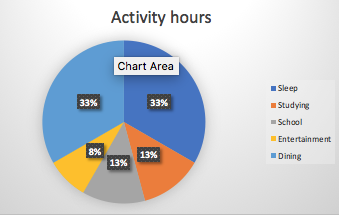
E 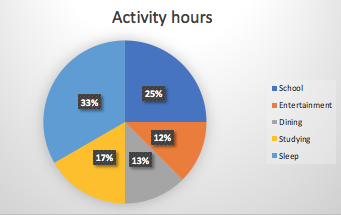
Açıklama:
DeA pie chart is usually used for categorical data. In pie chart components or outcomes of a total frequency is shown as sectors of a circle. The shape resembles to a pie, hence the name of the chart. In pie chart, the categories are divided in to slices/sectors. Each slices’ size is proportional to the total number of objects. The drawing of a pie chart involves the calculation of angles for each slice/sector. Find the calculation table and the chart below.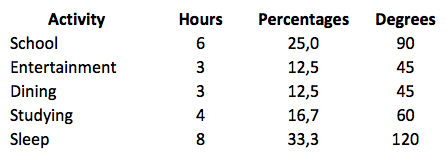
Soru 38
- Typically used to compare counts, frequencies, categories etc.
- Represents the frequencies with rectangles by their lengths
- Depending on the variable type, it is possible to create many types of it
Seçenekler
A
Stem-and-leaf
B
Dot plot
C
Histogram
D
Bar chart
E
pie chart
Açıklama:
Bar chart or sometimes called bar graphs are typically used to compare counts, frequencies, total number of categories, objectives, amounts etc. It is used for the graphical representation of the qualitative data. Bar chart is the graphical representation of frequencies by rectangles (or bars) with lengths (or heights) proportional to the frequencies of observations. Depending on the variable type and grouping, it is possible to create many types of bar chart
Soru 39
Which of the following is used to represent discrete values for each category for a given variable on horizontal axis while vertical axis show the actual numbers of each category?
Seçenekler
A
Stem-and-leaf
B
Simple bar chart
C
Stacked bar chart
D
Grouped bar chart
E
Pie chart
Açıklama:
Simple bar chart is used to represent discrete values for each category for a given variable on x-axis (horizontal). The y-axis (vertical) shows the actual numbers that are the bar heights for the corresponding category.
Soru 40
Which of the following is used for Likert type items to visualize the contribution of each subgroup of a category?
Seçenekler
A
Histogram
B
Stem-and-leaf
C
Stacked bar chart
D
Simple bar chart
E
Line chart
Açıklama:
The stacked bar chart is a bar chart where each bar is divided into subgroups proportional to the contribution a subgroup makes to associated bar. Likert type items are often represented by stacked bar chart.
Soru 41
- Used to represent continuous data
- Usually used when the sample is large
- Columns are adjacent to each other
Seçenekler
A
Stem-and-leaf
B
Bar chart
C
Histogram
D
Pie chart
E
Line chart
Açıklama:
Histogram is a graph that is very similar to a bar chart except that bar charts are drawn for qualitative data but histograms are drawn for continuous data. In order to draw the histogram of the data, we usually need to have a large sample. If you remember from previous chapters, the data was classified in to grouped frequency distributions, basically you can think histograms as bar plots of grouped frequency distributions. If you create a grouped frequency distribution of the data, you can easily create the histogram of the same data. Similarly, by looking at a histogram one may easily create the grouped frequency distribution of the data. In bar charts the columns/bars are separated from each other by a convenient distance whereas in histogram the columns/bars are adjacent to each other.
Soru 42
- Usually used to represent categorical data
- Divides categories as sectors
- Each sector's size shows the proportion of each category to the total
Which of the following do these features belong to?
Seçenekler
A
Simple bar chart
B
Stacked bar chart
C
Grouped bar chart
D
Pie chart
E
Line chart
Açıklama:
A pie chart is usually used for categorical data. In pie chart components or outcomes of a total frequency is shown as sectors of a circle. The shape resembles to a pie, hence the name of the chart. In pie chart, the categories are divided in to slices/sectors. Each slices’ size is proportional to the total number of objects.
Soru 43
Which of the following is preferably used to visualize a trend of continuous data over time?
Seçenekler
A
Histogram
B
Stem-and-leaf
C
Bar chart
D
Pie chart
E
Line chart
Açıklama:
Line chart is often used to display the trends in a continuous data over a period of time.
Soru 44
Consider the pie chart constructed based on the data presented above. What is the angle of the studying?Seçenekler
A
120 degrees
B
90 degrees
C
60 degrees
D
45 degrees
E
30 degrees
Açıklama:
The total time for the activities is 24 hours. 360 degrees represent 24 hours. So, one hour represented with 360/24 degree=15 degree. The angle of studying equals to 15x4=60 degrees.
Soru 45
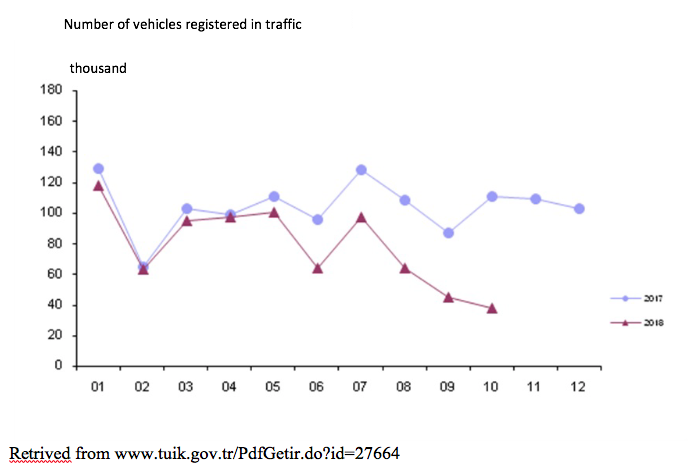 The graph represents the data of the number of vehicles registered in traffic by year. Purple line represents the 2017 data and maroon line represents the 2018 data. According to this graph, which of the following is the month when most vehicles are registered to traffic in 2018?
Seçenekler
A
1
B
2
C
5
D
7
E
10
Açıklama:
According to graphic, in 2018, during the second month of the year near 60 thousand vehicles, the fifth and seventh month of the year 100 thousand vehicles, and the tenth month of the year near 40 thousand vehicles are registered. However, during the first month near 120 thousand vehicles are registered. Thus, first month of the year is the month that the most vehicles are registered.
Soru 46
The graph represents the data of the number of vehicles registered in traffic by year. Purple line represents the 2017 data and maroon line represents the 2018 data. According to this graph, which of the following is the month when nearly equal number of vehicles are registered both in 2017 and 2018?Seçenekler
A
2nd
B
10th
C
4th
D
2nd and 4th
E
1st and 2nd
Açıklama:
According to this graph, 2nd and 4th months are the months that equal number of vehicles are registered both in 2017 and 2018. During 2nd month nearly 60 thousand vehicles and during 4th month nearly 100 thousand vehicles were registered.
Soru 47
 According to the stem-and-leaf plot above, what is the range of the data?
Seçenekler
A
47
B
49
C
65
D
402
E
909
Açıklama:
According to the plot, the maximum value of the data is 97 and the minimum value is 48. Range is the difference between the minimum and the maximum. Thus the rang is 97-48=49.
Soru 48
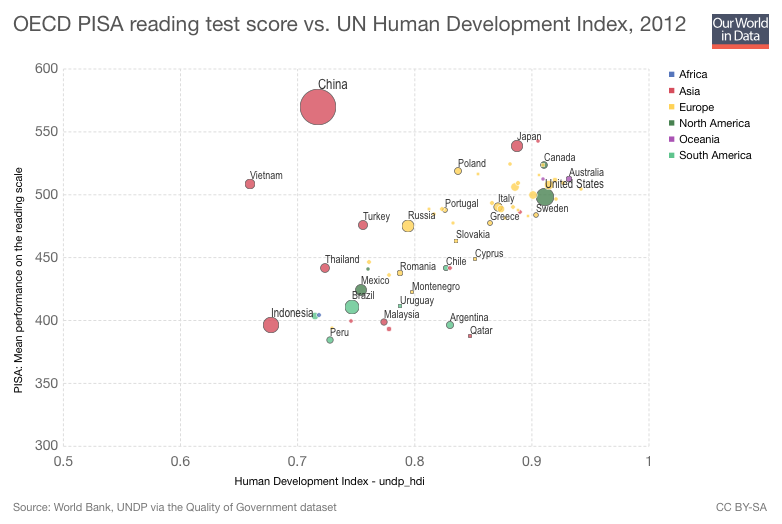 Retrieved from https://ourworldindata.org/quality-of-education
The following plot represents the relation between the PISA reading scores and the United Nations' Human Development Index (HDI) for a select group of countries.
According to the scatterplot above and considering straight line that indicates relationship, which one of the following is true?
Seçenekler
A
The straight line tends to have positive slope
B
The straight line tends to have negative slope
C
No relationship can be claimed between two sets of data
D
Straight line to indicate the negative correlation between two sets of data.
E
The is not any outlier data for statistical analysis.
Açıklama:
Scatter plot can also be used with a straight line to indicate the correlation between two sets of data. A regression line is added to scatter plot will show a very good indication about the direction of the relationship between two variables. The values of both variables are increasing, hence there is a positive relationship between these two variables. Thus, the straight line tends to have positive slope.
Soru 49
- Include the relative frequency of each bin (class) to your grouped frequency distribution
- Determine the sample size
- Draw a rectangular for each bin
- Create the grouped frequency distribution of the data
Seçenekler
A
II, I, IV, III
B
IV, II, III, I
C
II, I, IV, III
D
I, II, III, IV
E
II, IV, I, III
Açıklama:
To create a histogram for continuous data, the following steps may be used:
1. Determine the sample size,
2. Create the grouped frequency distribution of the data
3. Include the relative frequency of each bin (class) to your grouped frequency distribution
4. Draw a rectangular for each bin.
1. Determine the sample size,
2. Create the grouped frequency distribution of the data
3. Include the relative frequency of each bin (class) to your grouped frequency distribution
4. Draw a rectangular for each bin.
Soru 50
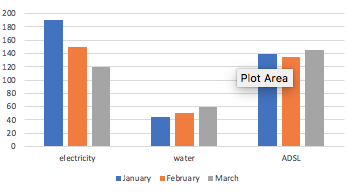 The graph shows the electricity, water and ADSL bills of a family. Which one of the following can be deduced, based on the data?
Seçenekler
A
The highest bill is for March.
B
The highest bill is for January.
C
There is a negative relationship between electricity consumption and water consumption.
D
ADSL bill is rising from January to March.
E
Lowest bill is for ADSL.
Açıklama:
The graph indicates that higher consumption of electricity tend to have lower water consumption through months.
Ünite 4
Soru 1
Mode is the.......value in a data set.
Which of the following correctly fills in the blank in the sentence above?
Which of the following correctly fills in the blank in the sentence above?
Seçenekler
A
Minimum
B
Maximum
C
Average
D
Most frequent
E
Least frequent
Açıklama:
Mode is the most frequent value in a data set.
Soru 2
What happens to arithmetic average of a data set if all observations are increased by 4?
Seçenekler
A
It doesn't change.
B
It increases by 4.
C
It decreases by 4.
D
It increases by 2.
E
It decreases by 2.
Açıklama:
Suppose there are n observations; x1, x2, x3, x4.......xn, and the arithmetic mean is k. Thus the sum of observations is n*k=(x1+x2+x3+x4.......+xn). If we increase all observations by 4, the new values will be 4+x1, 4+x2, 4+x3, 4+x4.......4+xn. Thus the new sum will be (4+4+...+4)+(x1+x2+x3+x4.......+xn)=4n+nk=n(4+k). If we divide this sum by n then the new arithmetic mean will be 4+k.
Soru 3
Which of the following is true for a left-skewed distribution as shown in figure?
Seçenekler
A
Mean=Mode=Median
B
Mean=Median
C
Mean
D
Mean>Median>Mode
E
Mean
Açıklama:
For left-skewed distributions Mean
Soru 4
The ages of children in a park are given as 10, 4, 8,10, 5, 6, 4, 5, 8,9. What is the median age of this group of children?
Seçenekler
A
5
B
9
C
8
D
6
E
7
Açıklama:
First we have to reorder the ages in an increasing or decreasing order. Let's do it in an increasing order. Then the ages will be:
4,4,5,5,6,8,8,9,10,10
Since there are 10 observations the median will be the average of the 5th and 6th observations. Thus,
median=(6+8)/2=7
4,4,5,5,6,8,8,9,10,10
Since there are 10 observations the median will be the average of the 5th and 6th observations. Thus,
median=(6+8)/2=7
Soru 5
 The data on weight distribution of a certain group of men is given on the table above. What is the mean weight for this group?
Seçenekler
A
71
B
73
C
75
D
80
E
81
Açıklama:
The mean can be calculated by multiplying the weight with their frequencies and summing them up.
Thus average (mean) weight=60*(30/100)+70*(40/100)+80*(20/100)+90*(10/100)=18+28+16+9=71
Thus average (mean) weight=60*(30/100)+70*(40/100)+80*(20/100)+90*(10/100)=18+28+16+9=71
Soru 6
 The exam scores of 5 students taking the statistics course are given above. The weight of midterm exam is 40% and the weight of final is 60%. What will be the weighted average score of this group?
Seçenekler
A
60
B
62
C
66
D
68
E
70
Açıklama:
The weighted average score is calculated by multiplying the weight of an exam and the score taken in that exam. Thus the scores of students are calculated as follows:
Ahmet: (40*0.4)+(80*0.6)=64
Mehmet: (80*0.4)+(60*0.6)=68
Ali: (40*0.4)+(90*0.6)=74
Asya: (70*0.4)+(90*0.6)=82
Suzan: (40*0.4)+(60*0.6)=52
Then the average score of the group is equal to (64+68+74+82+52)/5=68
Ahmet: (40*0.4)+(80*0.6)=64
Mehmet: (80*0.4)+(60*0.6)=68
Ali: (40*0.4)+(90*0.6)=74
Asya: (70*0.4)+(90*0.6)=82
Suzan: (40*0.4)+(60*0.6)=52
Then the average score of the group is equal to (64+68+74+82+52)/5=68
Soru 7
What is the geometric mean of the data set A=(6, 8, 9, 16, 36)?
Seçenekler
A
8
B
12
C
16
D
18
E
20
Açıklama:
Geometric mean is found by the formula GM=(x1x2x3....xn)1/n . So in this case
GM=(6*8*9*16*36)1/5=12
GM=(6*8*9*16*36)1/5=12
Soru 8
 Bicycle types and their prices in a certain shop are given above. What is the midrange of the bicycle prices?
Seçenekler
A
275
B
400
C
550
D
700
E
900
Açıklama:
Midrange is the average of the maximum and minimum value of observations. Thus for this bicycle prices the midrange is (900+200)/2=550
Soru 9
A researcher wants to calculate the average income for a large group of people but he notices that there are a few extremely low and extremely high income levels. Thus he decides to find the average after eliminating the extreme values. In this case the researcher computes ........
Which of the following correctly fills in the blank in the sentence above?
Which of the following correctly fills in the blank in the sentence above?
Seçenekler
A
Trimmed mean
B
Geometric mean
C
Arithmetic mean
D
Harmonic mean
E
Midrange
Açıklama:
The trimmed mean is an arithmetic mean of a data set without extreme values.
Soru 10
Which of the following statements is true?
Seçenekler
A
Mean of a left-skewed distribution is larger than the mode of it.
B
Median of a left-skewed distribution is larger than the mode of it.
C
Mean of a right-skewed distribution is smaller than the mode of it.
D
Mode and median of a normal distribution are larger than its' mean.
E
Mean, mode and median of a normal distribution are equal.
Açıklama:
Only the statement in E is true. For left-skewed distributions meanmedian>mode. But for normal distributions all these measures are same.
Soru 11
What is the mode of the following data set?
10, 19, 11, 26, 26, 26, 18, 20, 35, 99, 11, 14, 18, 18, 26, 20, 48
10, 19, 11, 26, 26, 26, 18, 20, 35, 99, 11, 14, 18, 18, 26, 20, 48
Seçenekler
A
10
B
26
C
35
D
48
E
99
Açıklama:
26 : occurs most often, it is repeated 4 times
Soru 12
What is the median of the following data set?
4, 4, 4, 5, 7, 8, 10, 14, 18, 20, 26, 30
4, 4, 4, 5, 7, 8, 10, 14, 18, 20, 26, 30
Seçenekler
A
4
B
9
C
17
D
30
E
34
Açıklama:
9 : median = (12 + 1) / 2 = 6.5 th observation ; then average of 6th and 7th observations : (8 + 10) / 2 = 9
Soru 13
What is the midrange of the following data set?
10, 19, 11, 26, 26, 26, 18, 20, 35, 98, 11, 14, 18, 18, 26, 20, 48
10, 19, 11, 26, 26, 26, 18, 20, 35, 98, 11, 14, 18, 18, 26, 20, 48
Seçenekler
A
10
B
26
C
35
D
54
E
98
Açıklama:
Midrange = (x_min + x_max) / 2 = (10 + 98) / 2 = 54
Soru 14
What is the arithmetic mean of the following data set?
4, 4, 6, 7, 8, 10, 11, 12, 18, 32
4, 4, 6, 7, 8, 10, 11, 12, 18, 32
Seçenekler
A
4
B
9
C
9.5
D
11.2
E
17
Açıklama:
arithmetic mean = sum of numbers / no of numbers = (4 + .. + 32) / 10 = 112 / 10 = 11.2
Soru 15
What is the arithmetic mean of the following data set with weights in paranthesis?
20 (10 %), 40 (20 %), 60 (30 %), 80 (40 %)
20 (10 %), 40 (20 %), 60 (30 %), 80 (40 %)
Seçenekler
A
15
B
25
C
30
D
45
E
50
Açıklama:
(20 x 10 % + 40 x 20 % + 60 x 30 % x + 80 x 40 %) / 4 = (2 + 8 + 18 + 32) / 4 = 60 / 4 = 15
Soru 16
What is the geometric mean of the following data set?
8, 27, 64
8, 27, 64
Seçenekler
A
18
B
24
C
25
D
33
E
36
Açıklama:
(8 x 27 x 64)-3 = 2 x 3 x 4 = 24
Soru 17
What is the arithmetic mean of the following data set with frequency in paranthesis? 25 (3), 35 (3), 45 (2)
Seçenekler
A
33.75
B
35
C
37.5
D
40
E
82.5
Açıklama:
(25 x 3 + 35 x 3 + 45 x 2) / 8 = 270 / 8 = 33.75 . Correct answer is A.
Soru 18
What is the mode of the following data set with frequency in paranthesis?
15 (2), 30 (4), 35 (3), 40 (3), 95 (2)
15 (2), 30 (4), 35 (3), 40 (3), 95 (2)
Seçenekler
A
30
B
35
C
45
D
60
E
110
Açıklama:
30 : occurs most often, it is repeated 4 times
Soru 19
What is the midrange of the following data set with frequency in paranthesis?
14 (2), 34 (4), 38 (3), 44 (3), 96 (2)
14 (2), 34 (4), 38 (3), 44 (3), 96 (2)
Seçenekler
A
96
B
55
C
34
D
26
E
14
Açıklama:
Midrange = (x_min + x_max) / 2 = (14 + 96) / 2 = 55
Soru 20
What is the median of the following data set with frequency in paranthesis?
12 (2), 32 (4), 35 (3), 43 (3), 92 (2)
12 (2), 32 (4), 35 (3), 43 (3), 92 (2)
Seçenekler
A
12
B
17
C
32
D
35
E
52
Açıklama:
35 : median = (14 + 1) / 2 = 7.5 th observation ; then average of 7th and 8th observations : (35 + 35) / 2 = 35
Soru 21
For an observation that results in values 6,7,3,4,3,5,6,6 what is the mode of this group?
Seçenekler
A
7
B
6
C
5
D
4
E
3
Açıklama:
In order to find the mode of this raw data, first, let’s order the data from smallest to largest as follows 3,3,4,5,6,6,6,7
The number 3 is repeated 2 times, 4 is repeated 1 time, 5 is repeated 1 time, 6 is repeated 3 time, 7 is repeated 1 time. Therefore, for this data set, it can be said that the mode is 6. The answer is B.
The number 3 is repeated 2 times, 4 is repeated 1 time, 5 is repeated 1 time, 6 is repeated 3 time, 7 is repeated 1 time. Therefore, for this data set, it can be said that the mode is 6. The answer is B.
Soru 22
For an observation that results in values 4,2,6,7,3,4,3,5,6,6,3 what is the mode of this group?
Seçenekler
A
3
B
4
C
6
D
3 and 4
E
3 and 6
Açıklama:
In order to find the mode of this raw data, first, let’s order the data from smallest to largest as follows 2,3,3,3,4,4,5,6,6,6,7
The number 2 is repeated 1 time, 3 is repeated 3 times, 4 is repeated 2 time, 5 is repeated 1 time, 6 is repeated 3 time, 7 is repeated 1 time. Therefore, for this data set, it can be said that there are two modes and these modes are 3 and 6. The answer is E.
The number 2 is repeated 1 time, 3 is repeated 3 times, 4 is repeated 2 time, 5 is repeated 1 time, 6 is repeated 3 time, 7 is repeated 1 time. Therefore, for this data set, it can be said that there are two modes and these modes are 3 and 6. The answer is E.
Soru 23
For an observation that results in values 6,7,3,4,3,5,6,6 what is the median of this group?
Seçenekler
A
5
B
5,5
C
6
D
6,5
E
7
Açıklama:
In order to find the median of this raw data, first, let’s order the data from smallest to largest as follows 3,3,4,5,6,6,6,7
The location of the median in this ordered data is (8+1)/2 = 4,5th observation. Therefore, we
need to identify the 4th and 5th observations’ values in the ordered data, these are 5 and 6 respectively.
The Median is equal to (5+6)/2 = 5,5
The answer is B.
The location of the median in this ordered data is (8+1)/2 = 4,5th observation. Therefore, we
need to identify the 4th and 5th observations’ values in the ordered data, these are 5 and 6 respectively.
The Median is equal to (5+6)/2 = 5,5
The answer is B.
Soru 24
For an observation that results in values 6,7,3,4,3,5,6,6 what is the arithmetic mean of this group?
Seçenekler
A
4
B
4,5
C
5
D
5,5
E
6
Açıklama:
There are 8 observation in this data set. The sum of all the observation result's values is 6+7+3+4+3+5+6+6 = 40
If we divide this value by the number of observation, which is 8, we will find 40/8 = 5 which is the arithmetic mean of this data set. The answer is C.
If we divide this value by the number of observation, which is 8, we will find 40/8 = 5 which is the arithmetic mean of this data set. The answer is C.
Soru 25
What is the mode of the following data set?
14, 17, 22, 2, 25, 4, 14, 6, 35, 93, 11, 14, 25, 18, 18, 25, 20, 14, 14, 48, 18, 25, 48
14, 17, 22, 2, 25, 4, 14, 6, 35, 93, 11, 14, 25, 18, 18, 25, 20, 14, 14, 48, 18, 25, 48
Seçenekler
A
14
B
25
C
35
D
48
E
93
Açıklama:
14 : occurs most often, it is repeated 5 times. pg. 77. Correct answer is A.
Soru 26
What is the median of the following data set?
2, 4, 2, 6, 7, 9, 11, 17, 18, 14, 26, 30, 2, 2
2, 4, 2, 6, 7, 9, 11, 17, 18, 14, 26, 30, 2, 2
Seçenekler
A
2
B
9
C
14
D
30
E
34
Açıklama:
14 : median = (14 + 1) / 2 = 7.5 th observation ; then average of 7th and 8th observations : (11 + 17) / 2 = 14. pg. 81. Correct answer is C.
Soru 27
What is the midrange of the following data set?
11, 18, 10, 25, 25, 81, 26, 18, 20, 35, 14, 11, 18, 18, 25, 20, 48
11, 18, 10, 25, 25, 81, 26, 18, 20, 35, 14, 11, 18, 18, 25, 20, 48
Seçenekler
A
11
B
18
C
35
D
46
E
81
Açıklama:
Midrange = (x_min + x_max) / 2 = (11 + 81) / 102 = 46. pg. 96. Correct answer is D.
Soru 28
What is the arithmetic mean of the following data set?
2, 4, 4, 6, 7, 8, 10, 11, 14, 22, 28, 4
2, 4, 4, 6, 7, 8, 10, 11, 14, 22, 28, 4
Seçenekler
A
4
B
9
C
10
D
11
E
12
Açıklama:
arithmetic mean = sum of numbers / no of numbers = (2 + .. + 28) / 12 = 120 / 12 = 10 . pg. 85. Correct answer is C.
Soru 29
What is the arithmetic mean of the following data set with weights in paranthesis?
60 (10 %), 50 (15 %), 70 (25 %), 90 (30 %), 80 (40 %)
60 (10 %), 50 (15 %), 70 (25 %), 90 (30 %), 80 (40 %)
Seçenekler
A
50
B
30
C
25
D
20
E
18
Açıklama:
(60 x 10 % + 50 x 15 % + 70 x 25 % + 80 x 30 % x + 60 x 40 %) / 5 = (6 + 7.5 + 17.5 + 27 + 32) / 5 = 90 / 5 = 18. pg. 85. Correct answer is E.
Soru 30
What is the geometric mean of the following data set?
64, 125, 216
64, 125, 216
Seçenekler
A
96
B
105
C
120
D
128
E
144
Açıklama:
(64 x 125 x 216)1/3 = 4 x 5 x 6 = 120. pg. 92. Correct answer is C.
Soru 31
What is the arithmetic mean of the following data set with frequency in paranthesis?
20 (3), 32 (4), 47 (2), 10 (3)
20 (3), 32 (4), 47 (2), 10 (3)
Seçenekler
A
18
B
26
C
32.5
D
36
E
40.5
Açıklama:
(20 x 3 + 32 x 4 + 47 x 2 + 10 x 3) / 12 = 312 / 12 = 26. pg. 87. Correct answer is B.
Soru 32
What is the mode of the following data set with frequency in paranthesis?
11 (3), 24 (2), 27 (3), 33 (2), 39 (4), 42 (3), 97 (2)
11 (3), 24 (2), 27 (3), 33 (2), 39 (4), 42 (3), 97 (2)
Seçenekler
A
26
B
28
C
39
D
42
E
108
Açıklama:
39 : occurs most often, it is repeated 4 times. pg. 81. Correct answer is C.
Soru 33
What is the midrange of the following data set with frequency in paranthesis?
15 (2), 25 (4), 38 (3), 44 (3), 64 (3), 105 (2)
15 (2), 25 (4), 38 (3), 44 (3), 64 (3), 105 (2)
Seçenekler
A
105
B
64
C
60
D
44
E
25
Açıklama:
Midrange = (x_min + x_max) / 2 = (15 + 105) / 2 = 60. pg. 96. Correct answer is C.
Soru 34
What is the median of the following data set with frequency in paranthesis? 16 (3), 33 (1), 36 (2), 48 (2), 66 (4), 92 (4)
Seçenekler
A
26
B
38
C
42
D
54
E
57
Açıklama:
57 : median = (16 + 1) / 2 = 8.5 th observation ; then average of 8th and 9th observations : (48 + 66) / 2 = 57. pg. 81. Correct answer is E.
Soru 35
I. Most frequent value(s) is the arithmetic mean
II. Middle number in ordered data by magnitude is the median
III. Average number of values is the mode
Which of the definitions about central tendency measures is true?
II. Middle number in ordered data by magnitude is the median
III. Average number of values is the mode
Which of the definitions about central tendency measures is true?
Seçenekler
A
Only I
B
Only II
C
I and II
D
I and III
E
II and III
Açıklama:
Most frequent value(s) is the mode. Middle number in ordered data by magnitude is the median. Average number of values is the arithmetic mean. The answer is B
Soru 36
I. It is defined as the tendency of data to cluster around some random variable value.
II. Some central tendency measures are arithmetic mean, median and mode
III. Central tendency measures can tell us details about every piece of data.
What can be said to be true about central tendency measures?
II. Some central tendency measures are arithmetic mean, median and mode
III. Central tendency measures can tell us details about every piece of data.
What can be said to be true about central tendency measures?
Seçenekler
A
Only I
B
Only II
C
I and II
D
I and III
E
II and III
Açıklama:
I. It is defined as the tendency of data to cluster around some random variable value. (True)
II. Some central tendency measures are arithmetic mean, median and mode. (True)
III. Central tendency measures can tell us details about every piece of data. (False, Central tendency measures do not tell us details about every piece of data.)
The answer is C.
II. Some central tendency measures are arithmetic mean, median and mode. (True)
III. Central tendency measures can tell us details about every piece of data. (False, Central tendency measures do not tell us details about every piece of data.)
The answer is C.
Soru 37
What is the geometric mean of the numbers 4, 10, and 25?
Seçenekler
A
10
B
12
C
14
D
16
E
18
Açıklama:
The geometric mean is found by taking the nth root of all the observation's multiplication. For 4, 10, 25 their multiplication is 4*25*10=1000 and the cubic root of 1000 is 10. The answer is A.
Soru 38
For an observation that results in values 6,7,3,4,3,5,6 what is the midrange arithmetic mean of the group?
Seçenekler
A
5
B
6
C
7
D
8
E
9
Açıklama:
Midrange is an arithmetic mean of the extremes in both end of the data set. It only needs the smallest
value and the largest value to be given. The arithmetic mean of the maximum and minimum value of the set gives the midrange. For the set 6,7,3,4,3,5,6 the minimum value is 3 and the maximum value is 7 therefore the midrange would be equal to (7+3)/2 = 5. The answer is A.
value and the largest value to be given. The arithmetic mean of the maximum and minimum value of the set gives the midrange. For the set 6,7,3,4,3,5,6 the minimum value is 3 and the maximum value is 7 therefore the midrange would be equal to (7+3)/2 = 5. The answer is A.
Soru 39
For an observation that results in values 6,7,3,4,3,5,6 what is the 30% Winsorized mean of the group?
Seçenekler
A
2
B
3
C
4
D
5
E
6
Açıklama:
The Winsorized mean can be calculated with the remaining values after replacing a certain number or the proportion of the values at the low and high end of the sorted data. First the data set is ordered from smallest to largest 3,3,4,5,6,6,7 then we will find how many data points will be replaced, k, since the winsorizing is 30% and there are 7 observations, the value of k is k = np = 7×0.30 = 2,1 which is nearly 2. Therefore, 2 observation from each end of the sorted data will be replaced with those next in magnitude, these observations are as follows, 3 is replaced with 4 and 7 and 6 is replaced with 6. The set yields to 4,4,4,5,6,6,6. The 30% Winsorized mean of the data set is (4+4+4+5+6+6+6)/7= 5. The answer is D.
Soru 40
For an observation that results in values 6,7,2,4,3,5,6 what is the %30 trimmed (truncated) mean of the group?
Seçenekler
A
2
B
3
C
4
D
5
E
10
Açıklama:
The trimmed or as it may sometimes be called as the truncated mean is a slightly modified version of the
arithmetic mean. Trimmed or truncated mean is calculated after a certain number or proportion of the lowest and highest observations from the sorted data are removed (trimmed) from the calculations. First, the data is ordered from smallest to largest, as follows, 2,3,4,5,6,6,7. Then we will find how many data points will be discarded, k, since the trimming is 30% and there are 7 observations, the value of k is k = np = 7×0.30 = 2,1 which is nearly 2. Therefore two 2,3,6 and 7 is removed from the set, which yields to 4,5,6. The sum, 15 is divided to n − 2k which is equal to 7 - 2*2=3 this results in the value 5.The answer is D.
arithmetic mean. Trimmed or truncated mean is calculated after a certain number or proportion of the lowest and highest observations from the sorted data are removed (trimmed) from the calculations. First, the data is ordered from smallest to largest, as follows, 2,3,4,5,6,6,7. Then we will find how many data points will be discarded, k, since the trimming is 30% and there are 7 observations, the value of k is k = np = 7×0.30 = 2,1 which is nearly 2. Therefore two 2,3,6 and 7 is removed from the set, which yields to 4,5,6. The sum, 15 is divided to n − 2k which is equal to 7 - 2*2=3 this results in the value 5.The answer is D.
Soru 41
Which one of the following is an example of central tendency measures?
Seçenekler
A
Variance
B
Mode
C
Range
D
Standard deviation
E
Correlation coefficient
Açıklama:
Central tendency is defined as “the tendency of data to cluster around some random variable value”. The position of the central value is measured by using central tendency measures such as arithmetic mean, median and mode. There are several names used to refer to central tendency in statistics such as “center of the distribution”, “central location”, “representative values”, “central position”, or “measures of location”.
Soru 42
What is mode?
Seçenekler
A
Middle number when the data is ordered from smallest to largest
B
Interval scale
C
Middle number when the data is ordered from largest to smallest
D
Ratio Scale
E
Most frequent value(s)
Açıklama:
Soru 43
Which level of measurement is not suitable for Median?
Seçenekler
A
Continuous
B
Discrete
C
Interval
D
Nominal
E
Ratio
Açıklama:
Soru 44
Which one of the following is an average number of values?
Seçenekler
A
Probability distribution
B
Arithmetic mean
C
Variance
D
Standard deviation
E
Binomial number
Açıklama:
Soru 45
What is the disadvantage of arithmetic mean?
Seçenekler
A
Influenced by outliers
B
Usually it is a big number
C
Usually it is a small number
D
Can not be calculated for ratio level of data
E
Can not be calculated for interval level of data
Açıklama:
Soru 46
What is the mode of following data set: 1, 2, 2, 2, 3, 3, 3, 4, 4, 4, 4, 4, 4, 4, 4, 5, 5, 6, 6, 7, 9?
Seçenekler
A
1
B
2
C
3
D
4
E
5
Açıklama:
The most repeated value is 4, therefore the mode is 4.
Soru 47
What is the mode of the following frequency distribution created for Age variable?
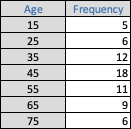
Seçenekler
A
15
B
25
C
35
D
45
E
75
Açıklama:
The highest frequency (18) is observed for 45, therefore mode is 45.
Soru 48
How do we define a data set which has two modes?
Seçenekler
A
Median
B
Bimodal
C
TripleModal
D
Nominal mode
E
Minimum mode
Açıklama:
If a data set has more than one mode, it refers to a multimodal distribution, indicating the frequencies of several observations with the similar highest frequencies. Specifically, when two values have the highest frequency in the data as in 1, 2, 2, 3, 4, 4, 5, 6, it is called as bimodal (2 and 4) distribution.
Soru 49
What is the median of the following data: 2, 4, 4, 4, 5, 6, 7, 7, 8, 10?
Seçenekler
A
2.5
B
4.5
C
5.5
D
8.5
E
10.5
Açıklama:
The data is already ordered. There are 10 observations:
(10+1)/2 = 5.5
so the median is the arithmetic mean of 5th and 6th observations:
median =(5 +6)/2=5.5
(10+1)/2 = 5.5
so the median is the arithmetic mean of 5th and 6th observations:
median =(5 +6)/2=5.5
Soru 50
What is the arithmetic mean of the following data: 2, 4, 5, 6, 7, 8, 9, 9, 9, 14?
Seçenekler
A
3.3
B
4.3
C
5.3
D
7.3
E
10.3
Açıklama:
mean = total / n
mean = 73 / 10
mean = 7.3
mean = 73 / 10
mean = 7.3
Soru 51
Which of the following refers to 'the average of a set of numbers in the data'?
Seçenekler
A
Standard deviation
B
IQR
C
Mean
D
Correlation
E
z-value
Açıklama:
'Mean' refers to the average of a set of numbers in the data. The correct answer is C.
Soru 52
What is the middle value of an ordered dataset called?
Seçenekler
A
Median
B
Ratio
C
Tendency
D
Mode
E
Mean
Açıklama:
The median is the middle value of an ordered dataset. The correct answer is A.
Soru 53
Which measure of central tendency is the best for nominal data sets?
Seçenekler
A
Mode
B
Median
C
Arithmetic mean
D
Geometric mean
E
Trimmed mean
Açıklama:
The mode is the main centrality measure for nominal scales. The correct answer is A.
Soru 54
What is 'the most frequent value in the entire data set' called?
Seçenekler
A
Trimmed mean
B
Median
C
Geometric mean
D
Mode
E
Arithmetic mean
Açıklama:
Mode is the most frequent value in the entire data. The correct answer is D.
Soru 55
6, 7, 8, 3, 3, 6, 9, 7, 3
What is the mode of the given data set?
What is the mode of the given data set?
Seçenekler
A
3
B
6
C
7
D
8
E
9
Açıklama:
The mode is 3 because it is the value that occurs most often. The correct answer is A.
Soru 56
28, 16, 14, 22, 12, 48, 10 What is the median of the given data set?
Seçenekler
A
14
B
16
C
21
D
22
E
28
Açıklama:
10, 12, 14, 16, 22, 28, 48
16 is the middle value of the set. The correct answer is B.
16 is the middle value of the set. The correct answer is B.
Soru 57
150, 95, 35, 42, 110, 60
What is the arithmetic mean of the given data set?
What is the arithmetic mean of the given data set?
Seçenekler
A
60
B
75
C
80
D
82
E
95
Açıklama:
150 + 95 + 35 + 42 + 110 + 60 = 492
492/6= 82
The correct answer is D.
492/6= 82
The correct answer is D.
Soru 58
- It is the best measure of central tendency for nominal data.
- It is the middle value of an ordered dataset.
- It can be preferred when the distribution is skewed.
Which of the given above about median is true?
Seçenekler
A
Only II
B
I & II
C
I & III
D
II & III
E
I, II & III
Açıklama:
Median cannot be used for nominal data sets.
It is the middle value of an ordered data set and preferred when there are outliers and the distribution is skewed.
The correct answer is D.
It is the middle value of an ordered data set and preferred when there are outliers and the distribution is skewed.
The correct answer is D.
Soru 59
Which of the following can be estimated by using ogive curve?
Seçenekler
A
Correlation
B
z-value
C
Median
D
Truncated Trimmed mean
E
Hypothesis value
Açıklama:
The median can also be estimated by using ogive curve (cumulative frequency polygon). The correct answer is C.
Soru 60
Which of the following is TRUE about symmetric bell-shape distributions?
Seçenekler
A
Only the mean and median are the same value.
B
The mean, median, and mode are all equal.
C
The median falls between the mean and mode.
D
The mean is smaller than median.
E
The mode is larger than the mean.
Açıklama:
In symmetric distributions like bell-shape and rectangular (or uniform)
ones, the mean and median are the same value. The correct answer is B
ones, the mean and median are the same value. The correct answer is B
Ünite 5
Soru 1
In a data set, what is the difference between the largest and smallest values called?
Seçenekler
A
Range
B
Frequency
C
Variance
D
Skewness
E
Standard Deviation
Açıklama:
The range of a data set, shown as R, is the difference between the largest and smallest values and calculated as follows:
R = Largest Value - Smallest Value
R = Largest Value - Smallest Value
Soru 2
During a sales season, the fifteen salesmen in a computer company sold the following numbers of computers: 7, 11, 5, 12, 17, 6, 13, 9, 8, 4, 23, 12, 7, 6, 11. What is the range of the number of sold computers?
Seçenekler
A
23
B
19
C
17
D
9
E
4
Açıklama:
The range of a data set, shown as R, is the difference between the largest and smallest values and calculated as follows: R = Largest Value - Smallest Value
Largest Value is 23
Smallest Value is 4
So, R=23-4 = 19.
The correct answer is B.
Largest Value is 23
Smallest Value is 4
So, R=23-4 = 19.
The correct answer is B.
Soru 3
The measures of ________ are another kind of descriptive statistics and give information about the shape of distribution of the observations.
Which option completes the blank in the description above?
Which option completes the blank in the description above?
Seçenekler
A
Skewness
B
Variance
C
Standard Deviation
D
Interquartile Range
E
Box Plot
Açıklama:
The measures of skewness are another kind of descriptive statistics and give information about the shape of distribution of the observations. A data set which is not symmetrically distributed is called skewed. The correct answer is A.
Soru 4
I. The mean is pulled in the direction of the tail.
II. The median falls between the mode and the mean.
III. The mean, median, and mode are all the same.
If the distribution is left skewed, having a long tail in negative direction and a single peak, which of the statements above are true?
II. The median falls between the mode and the mean.
III. The mean, median, and mode are all the same.
If the distribution is left skewed, having a long tail in negative direction and a single peak, which of the statements above are true?
Seçenekler
A
Only I
B
I and II
C
I and III
D
II and III
E
I, II and III
Açıklama:
The measures of skewness are another kind of descriptive statistics and give information about the shape of distribution of the observations. A data set which is not symmetrically distributed is called skewed. The mainly observed shapes of distribution are symmetric, left skewed (negatively skewed), and right skewed (positively skewed). If the distribution is unimodal symmetric, the mean, median, and mode are all the same. If the distribution is left skewed, having a long tail in negative direction and a single peak, the mean is pulled in the direction of the tail, and the median falls between the mode and the mean. The correct answer is B.
Soru 5
I. The central tendency measure of the distribution
II. A measure of the variability of the observations
III. The information of the distribution shape
Which pieces of information given above can be obtained from a box-plot?
II. A measure of the variability of the observations
III. The information of the distribution shape
Which pieces of information given above can be obtained from a box-plot?
Seçenekler
A
Only I
B
Only II
C
I and II
D
II and III
E
I, II and III
Açıklama:
What information can we obtain from a box plot? The central tendency measure of the distribution is indicated by the median line in the box plot. A measure of the variability of the observations is given by the length of the box. Also, by examining the relative location of the median line, we can obtain about the information of the distribution shape. The correct answer is E.
Soru 6
Which of the following statements is true according to the box-plot given below?
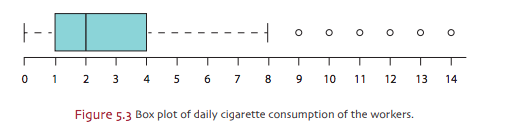
Seçenekler
A
The median is 4 cigarettes.
B
The interquartile range is 2 cigarettes.
C
The shape of the distribution is right-skewed.
D
The values greater than 4 are the outliers.
E
50% of the workers consume less than 4 cigarettes.
Açıklama:
The median is 2 cigarettes. This means that 50% of the workers consume less than 2 cigarettes, and 50% of the workers consume more than 2 cigarettes. The 25th and 75th percentiles are 1 and 4 cigarettes, respectively. This means that 25% of the workers consume is either less than or equal to 1 cigarettes and 75% of the workers consume leither 4 or fewer than 4 cigarettes a day. The interquartile range is 4-1=3 cigarettes. This means that 50% of the workers consume 3 cigarettes. The highest and the lowest values within the upper and the lower boundaries for outliers are 8 and 0, respectively. There are outliers in the data. The values greater than 8 are the outliers. The shape of the distribution is right skewed, because the median line is closer to the 25th percentile and also the whisker over the 75th percentile is longer than the other whisker.The correct answer is C.
Soru 7
Which option gives the correct terms to complete the blanks given in the graph in the correct order ( from 1 to 4)?
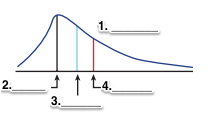
Seçenekler
A
Left skewed- mode - median - mean
B
Left skewed - mean - median - mode
C
Right skewed - mode- median- mean
D
Left skewed - median - mean - mode
E
Right skewed - median - mean - mode
Açıklama:
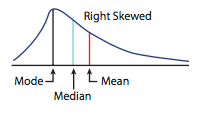 1. Right skewed
2. Mode
3. Median
4. Mean
The correct answer is C.
Soru 8
Which of the following is the most important and widely used measure of variability in statistics?
Seçenekler
A
Range
B
IQR
C
Standart Deviation
D
Box Plot
E
Skewness
Açıklama:
In order to avoid the disadvantages and misleading of the range and the IQR, we need a measure of variability that is based on including all measurements in a data set. The most important and widely used measure of variability in statistics is the standard deviation. To determine the variation of a data set in terms of the amounts, we need to measure the how much each observation deviates from the mean. The variability of a data set is small if the observations are close to their mean, and large if the observations are deviated widely about their mean. The correct answer is C.
Soru 9
The number of houses sold by each of the 10 estate agents during a particular 6 months period are 1, 4, 7, 6, 2, 10, 10, 3, 8, 9. What is the range of the data?
Seçenekler
A
10
B
9
C
5
D
3
E
1
Açıklama:
The range of a data set, shown as R, is the difference between the largest and smallest values and calculated as follows: R = Largest Value - Smallest Value
R = 10-1 = 9. The correct answer is B.
R = 10-1 = 9. The correct answer is B.
Soru 10
During a festival, the five bar tenders in the festival area sold the following number of beers in three days : 9540, 3600, 5566, 12345 and 8745. What is the range of the beers sold during the festival?
Seçenekler
A
12345
B
9540
C
8745
D
5566
E
3600
Açıklama:
The range of a data set, shown as R, is the difference between the largest and smallest values and calculated as follows: R = Largest Value - Smallest Value
R= 12345 -3600 = 8745
R= 12345 -3600 = 8745
Soru 11
Which of the following is not true about range?
Seçenekler
A
The range of a data set is shown as R.
B
Range is the difference between the largest and smallest values.
C
It depends only on the highest and lowest observations.
D
Range is heavily affected by these extremes values.
E
Range informs about the variability of the observations.
Açıklama:
The disadvantage of the range is that it depends only on the highest and lowest observations and it tells us nothing about the variability of the observations which fall between the two extremes.
Soru 12
Which of the following is not true about percentiles?
Seçenekler
A
The percentiles generally are demonstrated as P(m)
B
The percentiles take numbers between 0 and 100.
C
25th percentile is the second quantile.
D
75th percentile is the third quantile.
E
100th percentile is the fourth quantile.
Açıklama:
25th percentile is the first quantile.
Soru 13
Which of the following is not true about box plot?
Seçenekler
A
A measure of the variability of the observations is given by the length of the box.
B
The relative location of the median line gives information about the shape of the distribution.
C
If the median line is closer to the 25th percentile than the 75thpercentile, the distribution is right-skewed.
D
If the median line is closer to the 75th percentile than the 25thpercentile, the distribution is left-skewed.
E
If the median line is in the centre of the box, the distribution is not symmetric.
Açıklama:
If the median line is in the center of the box then we can conclude that the distribution is symmetric.
Soru 14
The data set: [20,20,20,25,25,30,35,35,40,40,45,45] What is the interquartile range of the data set above?
Seçenekler
A
5
B
10
C
15
D
20
E
25
Açıklama:
IQR = Q3 - Q1 = P(75) - P(25)=40-20=20
Soru 15
Which of the following is not true about skewness?
Seçenekler
A
A negative value near -3 shows that the distribution is considerably right-skewed.
B
The skewness gives information about the shape of the distribution.
C
If the distribution is unimodal, the mean, median and mode are the same.
D
If the distribution is left-skewed, having a long tail in a negative direction and a single peak
E
Pearson’s coefficient of skewness (PCS) can take values between -3 and 3.
Açıklama:
Pearson’s coefficient of skewness (PCS) can take values between -3 and 3. A negative value near -3 shows that the distribution is considerably left skewed and a positive value near 3 shows that the distribution is considerably left-skewed. If the PCS is near zero, this indicates that the distribution is symmetric because in this case the mean, the median, and the mode are similar.
Soru 16
A sample data set is given as follows; [14,15,15,16,17,18,20,21,22]
Which of the following is the Pearson’s coefficient of skewness (PCS) value of the sample data set given above?
Which of the following is the Pearson’s coefficient of skewness (PCS) value of the sample data set given above?
Seçenekler
A
0.584
B
3.423
C
0.412
D
4.987
E
0.1151
Açıklama:
Median=17
Mod=15
Mean=17.56
Standard deviation= 2.877
PCS = X − mode /s
PCS= 3(X − Median)/s
PCS= 3*(17.56-17)/2.877=0.584
Mod=15
Mean=17.56
Standard deviation= 2.877
PCS = X − mode /s
PCS= 3(X − Median)/s
PCS= 3*(17.56-17)/2.877=0.584
Soru 17
The number of the books have been read by the students in a year are given as follows; 10, 11, 11, 12, 14, 17, 18, 19, 20.
What is the range of the number of books have been read by students in this study?
What is the range of the number of books have been read by students in this study?
Seçenekler
A
11
B
12
C
10
D
14
E
15
Açıklama:
R = Largest Value - Smallest Value
20-10=10
20-10=10
Soru 18
The exam points of the students in a math course are as follows;
45, 53, 67, 74, 88, 88, 95, 95, 100.
Which of the following is the sample standard deviation of the data?
45, 53, 67, 74, 88, 88, 95, 95, 100.
Which of the following is the sample standard deviation of the data?
Seçenekler
A
20.137
B
18.379
C
12.197
D
19.723
E
18.419
Açıklama:
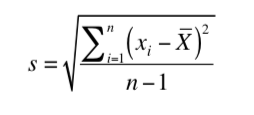 = 19.723
Soru 19
The height of the students in a classroom are as follows;
155, 156, 157, 160, 162, 165, 170, 180.
Which of the following is the median of the given data?
155, 156, 157, 160, 162, 165, 170, 180.
Which of the following is the median of the given data?
Seçenekler
A
160
B
161
C
162
D
163
E
164
Açıklama:
There are 8 observations, we need the find the middle value, the average of 4th and 5th observations is going to give us the result therefore (160+162)/2=161 is what we are looking for.
Soru 20
 The box plot is given above shows the data about the number of hours spent on watching tv a day by students in a school.
Which of the following is not correct about the box plot data?
Seçenekler
A
The median is two hours.
B
The interquartile range is three hours.
C
50% of the people watch three hours of TV a day.
D
The shape of the distribution is left-skewed.
E
There are outliers in the data.
Açıklama:
The shape of the distribution is right-skewed because the median line is closer to the 25th percentile and also the whisker over the 75th percentile is longer than the other whisker.
Soru 21
During a sales season, the five salesmen in a mobile phone company sold the following numbers of mobile phone: 9, 15, 8, 24, 30. What is the range of the number of sold mobile phones?
Seçenekler
A
22
B
21
C
15
D
9
E
6
Açıklama:
The range for grouped frequency distribution is calculated to be the difference of the upper limit of the highest value and the lower limit of the first class.
R=30-8=22
R=30-8=22
Soru 22
A farming company collected data about the amount of wheat (tons) sold in the last week to different companies. The data is as follows, 12, 35, 14, 25, 24, 40, 25. What is the mean of this data set?
Seçenekler
A
25
B
30
C
35
D
40
E
45
Açıklama:
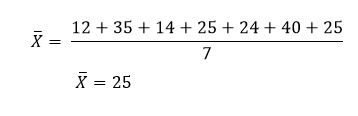
Soru 23
A farming company collected data about the amount of wheat (tons) sold in the last week. The data is as follows, 12, 35, 14, 25, 24, 40, 25. What is the standard deviation of the data set?
Seçenekler
A
10.13
B
12.51
C
14.85
D
16.82
E
18.28
Açıklama:
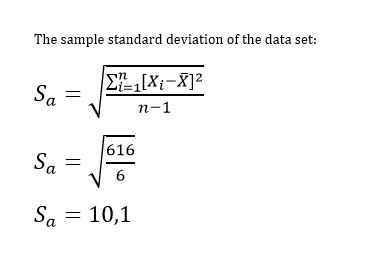
Soru 24
The frequency distribution table of the students’ performance scores of a school were constructed as follows. What is the sample mean of the data?
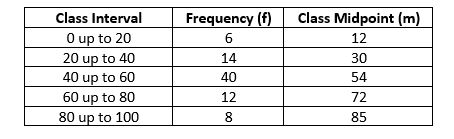
Seçenekler
A
52,4
B
53
C
54,5
D
55
E
56,8
Açıklama:
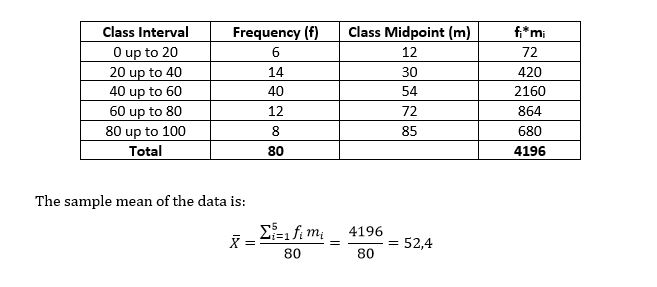
Soru 25
The frequency distribution table of the students’ performance scores of a school were constructed as follows. What is the sample standard deviation of the data?
Seçenekler
A
19,4
B
21,3
C
25,6
D
27,9
E
30,2
Açıklama:
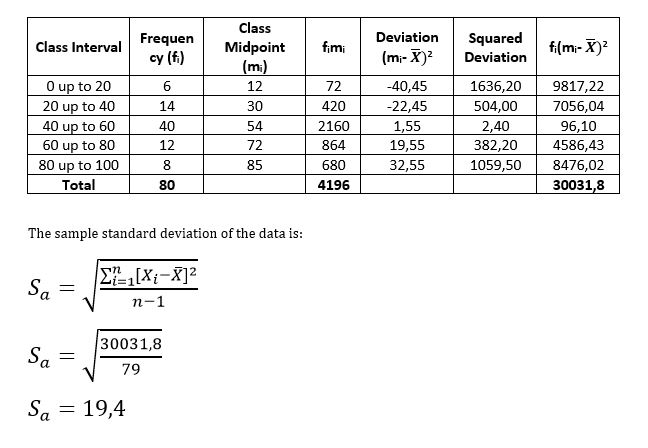
Soru 26
The standard deviation of the students’ performance scores data is 20. What is the variance of the data?
Seçenekler
A
350
B
360
C
370
D
380
E
400
Açıklama:
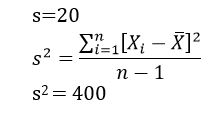
Soru 27
A bakery employs 10 people. The number of years’ experience that the employees of the company have is the following: 0, 0, 2, 4, 5, 8, 15, 17, 20, 24. What is the 50th percentile of the data?
Seçenekler
A
6,5
B
7,5
C
8,5
D
9,5
E
10,5
Açıklama:
Soru 28
Which class interval does contain the median?
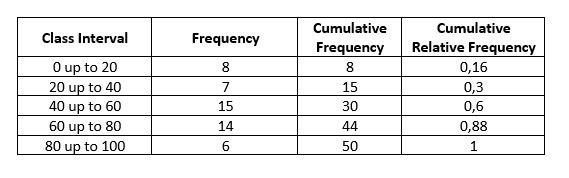
Seçenekler
A
0 up to 20
B
20 up to 40
C
40 up to 60
D
60 up to 80
E
80 up to 100
Açıklama:
To determine the interval that contains the median, we must find the first interval for which the cumulative relative frequency exceeds 0.50. This interval is the one containing the median. For the following data, the interval from 40 up to 60 is the first interval for which the cumulative relative frequency exceeds 0.50, so this interval contains the median.
Soru 29
A bakery employs 10 people. The number of years’ experience that the employees of the company have is the following: 0, 0, 2, 4, 5, 8, 15, 17, 20, 24. What is the 80th percentile of the data?
Seçenekler
A
18.5
B
19.5
C
20.5
D
21.5
E
22.5
Açıklama:
Soru 30
A bakery employs 10 people. The number of years’ experience that the employees of the company have is the following: 0, 0, 2, 4, 5, 8, 15, 17, 20, 24. What is the interquartile range of the data?
Seçenekler
A
10
B
15
C
20
D
25
E
30
Açıklama:
Soru 31
Which of the followings is not true about "range"?
Seçenekler
A
In order to find the range of a data set, researcher need to identify only two characteristics, the largest and smallest values.
B
Although the range is easy to calculate and to understand, it is generally not a very useful measure of variability.
C
The disadvantage of the range is that it depends only on the highest and lowest observations.
D
The range of a data set is the difference between the largest and smallest values.
E
In grouped frequency distribution, the value of the range will only be the lowest value.
Açıklama:
In grouped frequency distribution, the value of the range will only be an approximate value.
Soru 32
Which of the following is the most important and widely used measure of variability in statistics ?
Seçenekler
A
Range
B
Percentiles
C
Standard Deviation
D
Interquartile Range
E
Mode
Açıklama:
VARIANCE AND STANDARD DEVIATION
In order to avoid the disadvantages of the range, we need a measure of variability that is based on including all measurements in a data set. The most important and widely used measure of variability in statistics is the standard deviation.
In order to avoid the disadvantages of the range, we need a measure of variability that is based on including all measurements in a data set. The most important and widely used measure of variability in statistics is the standard deviation.
Soru 33
Which of the following is generally demonstrated as P(m), where m is the number taking values between 0 and 100?
Seçenekler
A
Range
B
Percentiles
C
Interquartile Range
D
Variance
E
Skewness
Açıklama:
The percentiles generally are demonstrated as P(m), where m is the number taking values between 0 and 100. Intuitively, the P(m) percentile of a set of n measurements, arranged in order of magnitude, is the value such m percent of the measurements are less than or equal to that corresponding value.
Soru 34
Which of the following statement is not true about "percentiles"?
Seçenekler
A
The percentiles generally are demonstrated as P(m), where m is the number taking values between 0 and 100.
B
Intuitively, the P(m) percentile of a set of n measurements, arranged in order of magnitude, is the value such m percent of the measurements are less than or equal to that corresponding value.
C
Some of the specific percentiles frequently used as variability measures are 25th, 50th, and 75th percentiles.
D
Various methods may be used for the calculation of percentiles.
E
In order to calculate the percentiles, the sample measurements must be sorted from largest to smallest.
Açıklama:
In order to calculate the percentiles, the sample measurements must be sorted in ascending order (from smallest to largest).
Soru 35
Which of the following is the differences between the third and the first quartiles?
Seçenekler
A
Percentiles
B
Range
C
Interquartile Range
D
Box Plot
E
Skewness
Açıklama:
The second variability measure is the interquartile range (IQR). The interquartile range is the differences between the third and the first quartiles.
Soru 36
Which of the following information cannot be obtained from a box plot?
Seçenekler
A
We can obtain the difference between the largest and smallest values.
B
The central tendency measure of the distribution is indicated by the median line in the box plot.
C
By examining the relative location of the median line, we can obtain about the information of the distribution shape.
D
We can obtain additional information about skewness from the lengths of the whiskers.
E
A general assessment can be made about the presence of outliers by examining the number of observations.
Açıklama:
BOX PLOT
The range of a data set is the difference between the largest and smallest values.
The range of a data set is the difference between the largest and smallest values.
Soru 37
Which of the followings is a kind of descriptive statistics and give information about the shape of distribution of the observations?
Seçenekler
A
Quartiles
B
Variance
C
Standard Deviation
D
Skewness
E
Box Plot
Açıklama:
The measures of skewness are another kind of descriptive statistics and give information about the shape of distribution of the observations. A data set which is not symmetrically distributed is called skewed.
Soru 38
During a sales season, the fifteen salesmen in a computer company sold the following numbers of computers: 7, 11, 5, 12, 17, 6, 13, 9, 8, 4, 23, 12, 7, 6, 11.
Which of followings is the range of the number of sold computers?
Which of followings is the range of the number of sold computers?
Seçenekler
A
R = 23 - 4 = 19
B
R = 4 - 23 = 19
C
R = 19 - 7 = 23
D
R = 11 - 5 = 19
E
R = 12 - 8 = 23
Açıklama:
The range for grouped frequency distribution is calculated to be the difference of the upper limit of the highest class and the lower limit of the first class. Therefore, it will be an approximate value.
Soru 39
The sample standard deviation and the sample variance for a frequency distribution can be calculated as follows.
s= ∑k fi(xi−X)2 i=1 n−1
s=∑k fi(xi−X)2 2 i=1 n−1
Which of the followings is not true related to this formula?
s= ∑k fi(xi−X)2 i=1 n−1
s=∑k fi(xi−X)2 2 i=1 n−1
Which of the followings is not true related to this formula?
Seçenekler
A
"k" is the number of classes/categories in the frequency distribution
B
"x" is the value of the i th class/category
C
"X" is the final result
D
"n" is the total frequency, n = ∑i=1 fi
E
ƒi is the frequency of the i th class/category
Açıklama:
VARIANCE AND STANDARD DEVIATION
X is the arithmetic mean
X is the arithmetic mean
Soru 40
A petrol company collected the data about the amount of fuel (tons) sold on two cities in a given Saturday. In each city the company has ten gas stations. The data is as follows.
City A: 3, 5, 6, 2, 7, 9, 8, 1, 4, 8
City B: 1, 4, 6, 2, 7, 19, 8, 1, 2, 18
Which of the followings is the sample mean of the city A?
City A: 3, 5, 6, 2, 7, 9, 8, 1, 4, 8
City B: 1, 4, 6, 2, 7, 19, 8, 1, 2, 18
Which of the followings is the sample mean of the city A?
Seçenekler
A
1.3
B
2.3
C
3.3
D
4.3
E
5.3
Açıklama:
VARIANCE AND STANDARD DEVIATION
X =3+5+!+8=53=5.3 A 10 10
X =3+5+!+8=53=5.3 A 10 10
Soru 41
Data : 4, 4, 5, 5, 5, 15, 15, 18, 19, 15, 4, 5, 14, 14, 17, 17, 26, 26, 22, 22. What is the range of this data ?
Seçenekler
A
4
B
5
C
14
D
26
E
22
Açıklama:
22 = 26 - 4. pg. 109. Correct answer is E.
Soru 42
Data : 0.2, 0.5, 0.17, 0.22, 0.26, 0.34, 0.39, 0.44, 0.55, 0.87, 1.1, 1.14, 2.5, 2.9, 4.4, 5.6. What is the 80th percentile of this data ?
Seçenekler
A
2.9
B
2.5
C
4.4
D
3.45
E
1.14
Açıklama:
16 numbers ; k = 16 x 80 / 100 = 12.8 not integer ; (⟦k⟧ + 1) = 12 + 1 = 13 ; P(13) = 2.5. pg. 117. Correct answer is B.
Soru 43
Data format : (class, class interval, frequency, cumulative frequency) ; data : (1, 100 up to 200, 5, 5), (2, 200 up to 300, 10, 14), (3, 300 up to 400, 16, 30), (4, 400 up to 500, 20, 50), (5, 500 up to 600, 10, 60) ; what is the 40th percentile of these data ?
Seçenekler
A
355
B
357.5
C
360
D
362.5
E
365
Açıklama:
k = 60 x 40 / 100 = 24 ; k is in the 3rd class ; P(k) = 300 + (100 / 16) (24 - 14) = 300 + 62.5 = 362.5 . pg. 117. Correct answer is D.
Soru 44
Data : 1.000, 1.000, 1.200, 1.200, 1.200, 1.400, 1.400, 1.500, 1.500, 1.500, 1.600, 1.600, 1.800, 1.800, 1.800, 2.000, 2.000, 2.500, 2.500, 2.500. What is the IQR of these data ?
Seçenekler
A
500
B
600
C
700
D
800
E
900
Açıklama:
The interquartile range IQR = P(75) - P(25) ; k1 = 20 x (75 / 100) = 15 ; P(75) = (1.800 + 2.000) / 2 = 1.900 ; k2 = 20 x (25 / 100) = 5 ; P(25) = (1.200 + 1.400) / 2 = 1.300 ; IQR = 1.900 - 1.300 = 600 . pg. 120. Correct answer is B.
Soru 45
Data : 100, 120, 120, 180, 200. What is the sample standard deviation of this data ?
Seçenekler
A
5.5251/2 / 3
B
6.6251/2 / 3
C
8.2751/2 / 3
D
7.4751/2 / 2
E
9.2501/2 / 2
Açıklama:
arithmetic mean : m = 720 / 5 = 145 ; s = ((452 + 252 + 252 + 352 + 552) / 4)1/2 = ((2.025 + 625 + 625 + 1225 + 3.025) / 4)1/2 = (7.475 / 4)1/2 . pg. 111 . Correct answer is D.
Soru 46
Data format : (class interval, frequency) data : (100 up to 120, 1), (120 up to 180, 2), (180 up to 200, 1), (200 up to 250, 1). What is the sample standard deviation of these data ?
Seçenekler
A
4.8501/2 / 3
B
7.5251/2 / 2
C
8.8751/2 / 3
D
6.6751/2 / 2
E
9.6251/2 / 3
Açıklama:
arithmetic mean : m = 850 / 5 = 170 ; s = ((602 + 202 + 202 + 102 + 552) / 4)1/2 = ((3.600 + 400 + 400 + 100 + 3.025) / 4)1/2 = (7.525 / 4)1/2. pg. 111. Correct answer is B.
Soru 47
Data : 20, 12, 16, 12, 10 ; what is the Pearson’s coefficient of skewness of these data ?
Seçenekler
A
0.80
B
-1.75
C
0.90
D
1.50
E
-1.20
Açıklama:
median : 12 ; arithmetic mean : m = 70 / 5 = 14 ; s = ((42 + 22 + 22 + 22 + 62) / 4)1/2 = 4 ; Pearson’s coefficient of skewness PCS = 3 (14 - 12) / 4 = 1.5 . pg. 122. Correct answer is D.
Soru 48
Data : 20, 12, 16, 12, 10 ; what is the standard coefficient of skewness of these data ?
Seçenekler
A
55 / 32
B
65 / 34
C
75 / 42
D
85 / 44
E
95 / 48
Açıklama:
a = 5 / (4 x 3) = 5 / 12 ; arithmetic mean : m = 70 / 5 = 14 ; s = ((42 + 22 + 22 + 22 + 62) / 4)1/2 = 4 ; standard coefficient of skewness SCS = (5 / 12) x ((43 + 23 + 23 + 23 + 63) / 43) = (5 / 12) ((64 + 24 + 216) / 64) = (5 / 12) (304 / 64) = (5 / 12) (76 / 16) = (5 / 12) (19 / 4) = 95 / 48. pg. 122. Correct answer is E.
Soru 49
Which one of the following ones is included in a box plot ?
Seçenekler
A
75th percentile
B
50th percentile
C
mean
D
standard deviation
E
mode
Açıklama:
75th percentile. pg. 121. Correct answer is A.
Soru 50
Data : 12, 16, 10, 20, 12 ; what is the mean deviation of these data ?
Seçenekler
A
3.2
B
4.6
C
5.2
D
4.4
E
3.8
Açıklama:
arithmetic mean : m = 70 / 5 = 14 ; s = (4 + 2 + 2 + 2 + 6) / 5 = 16 / 5 = 3.2 ; . pg. 112. Correct answer is A.
Ünite 6
Soru 1
Which of the followings cannot be given as an example for random experiments?
Seçenekler
A
Rolling a fair die.
B
Customers arriving at a particular store during some time interval.
C
Airplanes taking off in a given time interval at some airport.
D
Some particular customer requests in a bank.
E
Surveying an elemanatry level english classroom.
Açıklama:
A random experiment is any process that leads to two or more possible outcomes, without knowing exactly which outcome will occur.
For example, when a fair die is rolled we know that one of the six faces will show up but we will not be able to say exactly which face will actually show up. Thus, rolling a fair die is an example of a random experiment. Some further examples of random experiments are:
• Customers arriving at a particular store during some time interval.
• Airplanes taking off in a given time interval at some airport.
• Some particular customer requests in a bank.
Note that in a random experiment, although we do not know which outcome will occur, we are able to list or describe all of the possible outcomes.The set of all possible outcomes is important to understand the random experiment. Terefore, it is called a sample space, which is restated below as a definition.
Soru 2
According to classical probability, when rolling a fair dice, what is the probability of obtaining the number 5?
Seçenekler
A
5/6
B
4/6
C
3/6
D
2/6
E
1/6
Açıklama:
In the classical probability approach to assign a probability to an event, the assumption is that all the outcomes have the same chance of happening. Pick up a six-sided fair die, there are six numbers on each face of the die as 1, 2, 3, 4, 5, and 6. Classical probability says that each side of the die has the same chance to come face up if this die is thrown. Since there are 6 possible outcomes of throwing a six-sided fair die probability of obtaining any number represented on the faces of this six-sided fair die is 1/6. We can formularize this by following equation:
Probabilityof an Event = Thenumber of timestheevent can happen
/Total number of possibleoutcomes
Probabilityof an Event = Thenumber of timestheevent can happen
/Total number of possibleoutcomes
Soru 3
According to classical probability, when a fair dice is rolled, what is the probability of obtaining a number more than 4?
Seçenekler
A
0.167
B
0.267
C
0.333
D
0.433
E
0.555
Açıklama:
Using the same idea, we can try another example, what is the probability of obtaining a number more than 4 if we throw a six-sided fair die? Remember on a six-sided fair die, all the outcomes have the same chance to appear, in this example the question makes a restriction of observing values more than 4.
ere are only two outcomes to satisfy this restriction; those are the numbers 5, and 6; therefore, the probability we are looking for is
P(Morethan 4) = 2/6 = 1/3 = 0.333
The correct answer is C.
P(Morethan 4) = 2/6 = 1/3 = 0.333
The correct answer is C.
Soru 4
Which probability approach uses the relative frequencies to assign the probabilities to the events?
Seçenekler
A
Classical probability
B
Objective probability
C
Subjective probability
D
Positive probability
E
Empirical probability
Açıklama:
The empirical probability uses the relative frequencies to assign the probabilities to the events. The empirical probability is based on experiments. In order to find the probability of a specific event, the experiments are repeated many times and the observed outcomes of the event we are interested in is counted. The correct answer is E.
Soru 5
According to classical probability approach, what is the probability of obtaining a number 6 when you throw a six-sided fair die?
Seçenekler
A
0.167
B
0.267
C
0.333
D
0.467
E
0.533
Açıklama:
Classical probability says that each side of the die has the same chance to come face up if this die is thrown. Since there are 6 possible outcomes of throwing a six-sided fair die probability of obtaining any number represented on the faces of this six-sided fair die is 1/6. We can formularize this by following equation
Probability of an Event = The number of times the event can happen/ Total number of possible outcomes
P(Number 6) = 1 6 = 0.167
The correct answer is A.
Probability of an Event = The number of times the event can happen/ Total number of possible outcomes
P(Number 6) = 1 6 = 0.167
The correct answer is A.
Soru 6
According to empirical probability, which of the following statements is not true?
Seçenekler
A
It uses the relative frequencies to assign the probabilities to the events.
B
It is based on experiments.
C
To find the probability of a specific event, the experiments are repeated many times.
D
It states that all the outcomes have the same chance of happening.
E
In empirical probability, the past information becomes very important.
Açıklama:
The empirical probability uses the relative frequencies to assign the probabilities to the events. The empirical probability is based on experiments. In order to find the probability of a specific event, the experiments are repeated many times and the observed outcomes of the event we are interested in is counted. We can formularize this by following equation
The more experiment we do, we may get better results for the probability that we are looking for.
The correct answer is D.
The more experiment we do, we may get better results for the probability that we are looking for.
The correct answer is D.
Soru 7
In how many different ways can the letters in U-S-U-A-L-L-Y be arranged?
Seçenekler
A
5
B
10
C
15
D
20
E
25
Açıklama:
Note that there are five different letters, namely U, S, A, L, Y and that the letters U and L are used twice. If all the seven letters in the given word were different, the total number of arrangements would be 7!. Since all the arrangements of the two letters U1 and U2 , and all the arrangements of the two letters L1 and L2 should be counted only once, it follows that the answer is 7!/ 2!2! =15. The correct answer is C.
Soru 8
A manager in a company has two assistant directors. The probability that the older assistant director comes late to work on a given day is 0.07, whereas for the younger assistant director this probability is 0.05. In addition, the probability that both assistant directors come late to work on given day is 0.03. What is the probability that on a given day one or both assistant directors come late to work?
Seçenekler
A
0.87
B
0.97
C
1.07
D
1.17
E
1.27
Açıklama:
Note that this event corresponds to (O+Y -) , ( - O+Y - ) , ( - O+Y - ), and that (O+Y -) , ( - O+Y - ) , ( - O+Y - ) , (O+Y ) = S.
Therefore, P((O+Y - ) , ( - O+Y -) , ( -O+Y-)) = 1 - P(O+Y- ) = 1 - 0.03 = 0.97 The correct answer is B.
Therefore, P((O+Y - ) , ( - O+Y -) , ( -O+Y-)) = 1 - P(O+Y- ) = 1 - 0.03 = 0.97 The correct answer is B.
Soru 9
A shop selling mobile phones has purchased four new mobile phones of the same brand and model. It is known that a mobile phone of this brand and model works without any problem for at least 2 years with probability 0.95. What is the probability that all three mobile phones will work without any problem for at least 2 years?
Seçenekler
A
0.95
B
0.90
C
0.85
D
0.80
E
0.75
Açıklama:
Here, it is natural to assume that a failure of a mobile phone is independent from a failure of another mobile phone. Therefore, if Ai(i=1,2,3,4) denotes the event that the i-th mobile phone will work without any problem for at least 2 years, then the probability is given by
P(A1+A2+A3+A4) = P(A1)P(A2)P(A3)P(A4) = (0.90).
The correct answer is B.
P(A1+A2+A3+A4) = P(A1)P(A2)P(A3)P(A4) = (0.90).
The correct answer is B.
Soru 10
A manager of a café in a university campus assesses its customers as student, academic staff or visitor. She estimates that of all its customers 50% are students, 30% are academic staff and that 20% are visitors. It is known that purchases are made by 70% of student customers, by 60% of academic staff and by 30% of visitors. If a randomly chosen customer makes a purchase, what is the probability that this customer is a student?
Seçenekler
A
0,74
B
0,54
C
0,59
D
0,95
E
0,059
Açıklama:
Define the following events
S: Customer is a student
A: Customer is academic staff
V: Customer is a visitor
B: Customer makes a purchase
Then we need to find P(S⏐B), which is given by, P(S⏐B)=P(B⏐S)P(S)/P(B⏐S)P(S)+ P(B⏐A) P(A)+ P(B⏐V)P(V) = 0.35/0.59 ≅ 0.593
S: Customer is a student
A: Customer is academic staff
V: Customer is a visitor
B: Customer makes a purchase
Then we need to find P(S⏐B), which is given by, P(S⏐B)=P(B⏐S)P(S)/P(B⏐S)P(S)+ P(B⏐A) P(A)+ P(B⏐V)P(V) = 0.35/0.59 ≅ 0.593
Soru 11
What is the probability of obtaining a number more than 3 if we throw a six-sided fair dice?
Seçenekler
A
0,5
B
0,6
C
0,7
D
0,8
E
0,9
Açıklama:
Probability of an Event = The number of times the event can happen / Total number of possible outcomes
P (more than 3) = 3 / 6 = 0,5
P (more than 3) = 3 / 6 = 0,5
Soru 12
A six-sided fair dice has been thrown 1000 times and the occurrence of number 2 is 156. What is the empirical probability of obtaining a number 2 when you throw a six-sided fair dice?
Seçenekler
A
0,156
B
0,159
C
0,240
D
0,300
E
0,500
Açıklama:
Empirical Probability of an Event = The number of times the event happens/Total number of observations
P (Number 2)= 156 / 1000 =0,156
P (Number 2)= 156 / 1000 =0,156
Soru 13
In ___________ approach, the researcher assigns a suitable value as the probability of the event.
Which of the following fills the blank correctly?
Which of the following fills the blank correctly?
Seçenekler
A
Mutual Probability
B
Classic Probability
C
Empirical Probability
D
Objective Probability
E
Subjective Probability
Açıklama:
Sometimes it may not possible to observe the outcomes of events; therefore, the researcher may assign a probability to an event. In subjective probability approach, the researcher assigns a suitable value as the probability of the event. Therefore, a personal judgment comes in to play to assign the probability. This approach is not favorable method to assign probability, but sometimes if there’s no previous knowledge on the subject then the researcher may assign a subjective probability as a starting point.
Soru 14
If there are 20 different departments and 5 different elective courses, in how many different ways can a student be classified?
Seçenekler
A
100
B
150
C
200
D
250
E
300
Açıklama:
Consider any two experiments of which the first experiment can result in n1 and the second can result in n2 possible outcomes. Then, considering both experiments together, there are n1n2 possible outcomes.
P=20x5=100
P=20x5=100
Soru 15
In how many different ways can the letters in T H A N K S be arranged?
Seçenekler
A
700
B
720
C
740
D
760
E
780
Açıklama:
All the six letters in the given word were different, the total number of arrangements would be 6!.
6!=720
6!=720
Soru 16
A company works with two supplier firms for the same raw material. The first firm's late delivery probability on a given day is 0.05, whereas for the second firm this probability is 0.07. In addition, both firms' late delivery probability on given day is 0.04. What is the late delivery probability of at least one of the firms to company on given day?
Seçenekler
A
0.05
B
0.06
C
0.07
D
0.08
E
0.09
Açıklama:
P(OUY) = P(O) + P(Y) - P(O∩Y) = 0.05 + 0.07 - 0.04 = 0.08
Soru 17
At a local district, there are three different pizza restaurants denoted here by A, B, and C. It is known that 40% of all customers give an order from company A, whereas 35% give an order from company B, and 25% give an order from company C. It is also known that 10% of the motorcycles from company A, 20% of the motorcycles from company B, and 5% of the motorcycles from company C need to a checkup before the next pizza delivery. What is the probability that a motorcycle returned to the restaurant needs a checkup before the next pizza delivery?
Seçenekler
A
0,12
B
0,14
C
0,16
D
0,18
E
0,20
Açıklama:
P(A)=0.40 P(U/A)=0.10 P(U/A).P(A)=0.04
P(B)=0.35 P(U/B)=0.20 P(U/B).P(B)=0.07
P(C)=0.25 P(U/C)=0.05 P(U/C).P(C)=0.0125
P(U)=0,04+0,07+0,0125=0,12
P(B)=0.35 P(U/B)=0.20 P(U/B).P(B)=0.07
P(C)=0.25 P(U/C)=0.05 P(U/C).P(C)=0.0125
P(U)=0,04+0,07+0,0125=0,12
Soru 18
At a local district, there are three different pizza restaurants denoted here by A, B, and C. It is known that 40% of all customers give an order from company A, whereas 35% give an order from company B, and 25% give an order from company C. It is also known that 10% of the motorcycles from company A, 20% of the motorcycles from company B, and 5% of the motorcycles from company C need to a checkup before the next pizza delivery. If a motorcycle returned to the company needs a checkup before the next pizza delivery, what is the probability that this motorcycle was owned by company B?
Seçenekler
A
0,58
B
0,62
C
0,74
D
0,81
E
0,93
Açıklama:
P(A)=0.40 P(U/A)=0.10 P(U/A).P(A)=0.04
P(B)=0.35 P(U/B)=0.20 P(U/B).P(B)=0.07
P(C)=0.25 P(U/C)=0.05 P(U/C).P(C)=0.0125
P(U)= 0,04+0,07+0,0125=0,12
P(B/U)=0,07/0,12=0,58
P(B)=0.35 P(U/B)=0.20 P(U/B).P(B)=0.07
P(C)=0.25 P(U/C)=0.05 P(U/C).P(C)=0.0125
P(U)= 0,04+0,07+0,0125=0,12
P(B/U)=0,07/0,12=0,58
Soru 19
At a local district, there are three different pizza restaurants denoted here by A, B, and C. It is known that 40% of all customers give an order from company A, whereas 35% give an order from company B, and 25% give an order from company C. It is also known that 10% of the motorcycles from company A, 20% of the motorcycles from company B, and 5% of the motorcycles from company C need to a checkup before the next pizza delivery. If a motorcycle returned to the company needs a checkup before the next pizza delivery, what is the probability that this motorcycle was owned by company A?
Seçenekler
A
0,33
B
0,40
C
0,52
D
0,60
E
0,74
Açıklama:
P(A)=0.40 P(U/A)=0.10 P(U/A).P(A)=0.04
P(B)=0.35 P(U/B)=0.20 P(U/B).P(B)=0.07
P(C)=0.25 P(U/C)=0.05 P(U/C).P(C)=0.0125
P(U)= 0,04+0,07+0,0125=0,12
P(A/U)=0,04/0,12=0,33
P(B)=0.35 P(U/B)=0.20 P(U/B).P(B)=0.07
P(C)=0.25 P(U/C)=0.05 P(U/C).P(C)=0.0125
P(U)= 0,04+0,07+0,0125=0,12
P(A/U)=0,04/0,12=0,33
Soru 20
A six-sided fair dice has been thrown 3000 times and the occurrence of number 4 is 450. What is the empirical probability of obtaining a number 4 when you throw a six-sided fair dice?
Seçenekler
A
0,15
B
0,20
C
0,25
D
0,30
E
0,35
Açıklama:
Empirical Probability of an Event = The number of times the event happens/Total number of observations
P (Number 4)= 450 / 3000 =0,15
P (Number 4)= 450 / 3000 =0,15
Soru 21
Consider the random experiment of tossing a fair coin until a tail (T) and a head (H) show up once. Describe the sample space of this random experiment ?
Seçenekler
A
S = {H, T}
B
S = {HH, HT, TH, TT}
C
S = {HT, HT, HHT, HHHT}
D
S = {HT, TH, HHT, TTH, HHHT, ... }
E
S = {HT, TH, HHT, THH, HHHT, ... }
Açıklama:
S = {HT, TH, HHT, TTH, HHHT, ... }. pg. 133. Correct answer is D.
Soru 22
A mixed basketball team (5 players) will be chosen from 8 male and 7 female players. This team should consist of at least 2 female and at least 2 male players, how many different teams are possible?
Seçenekler
A
C(15, 5)
B
C(8, 3) + C(7, 2) + C(8, 2) * C(7, 3)
C
C(8, 3) * C(7, 2) + C(8, 2) * C(7, 3)
D
C(15, 3) * C(15, 2)
E
C(15, 3) + C(15, 2)
Açıklama:
C(8, 3) * C(7, 2) + C(8, 2) * C(7, 3) . pg. 137. Correct answer is C.
Soru 23
A box contains 10 glasses : 4 red and 6 blue. Two glasses are selected randomly, without replacement, from this lot. What is the probability that the first selected glass is blue?
Seçenekler
A
3 / 5
B
7 / 15
C
7 / 12
D
17 / 24
E
3 / 4
Açıklama:
S = {BR , BB , RB , RR} ; C(10, 2) = 10! / (2! * (10-2)!) = 10! / (2! * 8!) = 10 * 9 / 2 = 45 ; P(BR) + P(BB) = (6 / 10) * (4 / 9) + (6 / 10).* (5 / 9) = 6 * 4 / (10 * 9) + 6 * 5 / (10 * 9) = 4 / 15 + 1 / 3 = 9 / 15 = 3 / 5. pg. 137. Correct answer is A.
Soru 24
Assume that 20 percent of Statistics course students in Anadolu University take Music course, 10 percent take Swimming course, and 4 percent take both Music and Swimming courses. What percentage of Statistics students neither take Music nor Swimming course?
Seçenekler
A
80
B
74
C
70
D
66
E
34
Açıklama:
(S and M) = 20 % ; (S ansd Sw) : 10 % ; (S and M and Sw) = 4 % ; (S and (M or Sw)) = 26 % , (S and NOT(M and Sw) )= 100 - 26 = 74 % . pg. 138. Correct answer is B.
Soru 25
The probability of an event A is 0.6, the probability of an event B is 0.3. The probability that neither A nor B occurs is 0.25. What is the probability that both A and B occurs?
Seçenekler
A
0.35
B
0.30
C
0.25
D
0.20
E
0.15
Açıklama:
P(A or B) = 1 - 0.25 = 0.75 P(A and B) = P(A) + P(B) - 0.75 = 0..6 + 0.3 - 0.75 = 0.15 . pg. 138. Correct answer is E.
Soru 26
A jar contains 4 blue, 5 yellow, and 6 pink balls. If 3 balls are selected randomly, without replacement, what is the probability that the 4th ball selected is blue, given that the first 3 balls are blue, pink, yellow, respectively ?
Seçenekler
A
0.15
B
0.20
C
0.25
D
0.30
E
0.35
Açıklama:
3 / 12 = 1 / 4 = 0.25 . pg. 137. Correct answer is C.
Soru 27
The probability that Navigator A shows wrong way to an address is 0.09 and the probability that Navigator B shows wrong way to the same address is 0.07 and the probability that both Navigators show wrong way to the same address is 0.04. What is the probability that only one of the Navigators shows wrong way to the same address?
Seçenekler
A
0.16
B
0.14
C
0.12
D
0.10
E
0.08
Açıklama:
P(A) - P(A and B) + P(B) - P(A and B) = 0.09 - 0.04 + 0.07 - 0.04 = 0.08 . pg. 138. Correct answer is E.
Soru 28
Events A, B, and C are all independent and that B and C are mutually exclusive events. P(A)=0.04, P(B)=0.03, and P(C)=0.02. What is the probability that events A and B will occur or A will not occur and C will occur?
Seçenekler
A
0.0096
B
0.0128
C
0.0144
D
0.0204
E
0.0256
Açıklama:
P(A) * P(B) + P(not-A) * P(C) = 0.04 * 0.03 + 0.96 * 0.02 = 0.0012 + 0.0192 = 0.0204. pg. 138. Correct answer is D.
Soru 29
Consider an ultrasound software for brain tumor diagnosis : a) the overall rate of the disease in the population being screened is 1 % ; b) the probability that a healthy person wrongly gets a positive result (false positive) is 0.05 ; c) the probability that an ill wrongly gets a negative result (false negative) is 0.002 ; d) other 2 situations are correctly diagnosing healthy persons (true negative) and correctly diagnosing ills (true positive). If test of a person A gives a positive result, what is the probability that person A actually have the disease?
Seçenekler
A
0.0495
B
0.998 * 0.01 / 0.05948
C
0.06
D
0.099 * 0.02 / 0.064
E
0.095
Açıklama:
S = {people in the population being screened} , D = {have disease} , not-D = {do not have diesase} , pos = {positive result} , neg = {negative result} ; P (pos | not-D) = 0.05 , P (neg | D) = 0.002 , P (D) = 0.01 ; P (D | pos) = ? , P (D | pos) = P (pos | D) * P(D) / P(pos) (Bayes theorem) ; P (pos | D) = 1 - P ( neg | D) = 1 - 0.002 = 0.998 ; P (pos) = ? , P (pos) = P (pos | D) * P(D) + P (pos | not-D) * P(not-D) ; P (pos) = 0.998 * 0.01 + 0.05 * (1 - 0.01) = 0.00998 + 0.05 x 0.99 = 0.00998 + 0.0495 = 0.05948 ; P (D | pos) = 0.998 * 0.01 / 0.05948 ( = 0.168 = 16.8 % ) . pg. 141. Correct answer is B.
Soru 30
60 % of students take Statistics 2 course after Statistics 1 course. 25 % of students takes Statistics 2 course without taking Statistics 1 course. What is the probability that a student who takes Statistics 2 course has not taken Statistics 1 course?
Seçenekler
A
0.15
B
0.25
C
5 / 12
D
12 / 17
E
5 / 17
Açıklama:
25 / (25 + 60) = 25 / 85 = 5 / 17. pg. 141. Correct answer is E.
Soru 31
What can be said true about the basic concepts of probability?
Seçenekler
A
An event occurs if the random experiment results in one of the basic outcomes of that event.
B
A set of some of the possible outcomes of a random experiment is called the sample space.
C
Each possible outcome of a random experiment is called a sample space.
D
The set of all possible outcomes of a random experiment is called the elementary outcome.
E
A random experiment is any process that leads to a certain possible outcome.
Açıklama:
A random experiment is any process that leads to two or more possible outcomes, without knowing
exactly which outcome will occur. The set of all possible outcomes of a random experiment is called the sample space. Each possible outcome of a random experiment is called an elementary outcome. An event occurs if the random experiment results in one of the basic outcomes of that event. A is the correct answer.
exactly which outcome will occur. The set of all possible outcomes of a random experiment is called the sample space. Each possible outcome of a random experiment is called an elementary outcome. An event occurs if the random experiment results in one of the basic outcomes of that event. A is the correct answer.
Soru 32
I. The complement of an event A is the set of all basic outcomes in S that do not belong to A.
II. The union of events A and B is the set of all elementary outcomes that belong to both sets.
III. The intersection of events A and B is the set of all elementary outcomes that belong to at least one of the sets A and B.
For A and B, which are any two events in a random experiment with sample space S, which of the statements are true?
Seçenekler
A
Only I
B
Only II
C
I and II
D
I and III
E
II and III
Açıklama:
I. The complement of an event A is the set of all basic outcomes in S that do not belong to A. (True)
II. The union of events A and B is the set of all elementary outcomes that belong to both sets. (False, The intersection of events A and B is the set of all elementary outcomes that belong to both sets.)
III. The intersection of events A and B is the set of all elementary outcomes that belong to at least one of the sets A and B. (False, The union of events A and B is the set of all elementary outcomes that belong to at least one of the sets A and B.)
The answer is A.
Soru 33
When is A and B, which are any two events in a random experiment with sample space S, can be said to be mutually exclusive?
Seçenekler
A
A ∪ B = 0
B
A ∩ B = 0
C
A ∩ B = A
D
A ∩ B = A ∪ B
E
A ∪ B = A
Açıklama:
Sometimes it will be important to consider events that do not occur at the same time. That is the events whose intersection is the null event (empty set). If A and B are any two events then they are said to be mutually exclusive if A ∩ B = 0. The answer is B.
Soru 34
If there were two dices thrown at the same time what would their total number of possible outcomes be?
Seçenekler
A
6
B
12
C
24
D
36
E
48
Açıklama:
Each dice has a possible outcome of 6 in total {1,2,3,4,5,6}. If they are thrown at the same time the possible outcome would equal to 6*6 = 36. The answer is D.
Soru 35
In how many different ways can the letters in P R O B A B I L I T Y be arranged?
Seçenekler
A
11
B
55
C
66
D
110
E
11!
Açıklama:
When order is not important, the arrangements of r objects from n distinct objects is called a combination. The number of combinations of size r from a collection of n objects is denoted by C(n,r), and it is given by C(n,r)= P(n,r)/r! = n!/r!(n - r)! when 0≤r≤n.
For P R O B A B I L I T Y there are in total 11 letters but B and I is used twice so they should be counted only once.
r=9, n=11 therefore 11!/9!(11-9)! = (10*11)/2! = 55. The answer is B.
For P R O B A B I L I T Y there are in total 11 letters but B and I is used twice so they should be counted only once.
r=9, n=11 therefore 11!/9!(11-9)! = (10*11)/2! = 55. The answer is B.
Soru 36
I. For any event A⊆S, P(A)≥0.
II. For any event A, P(Ā) = 1 - P (A)
III. For any two events A and B, P(A,B) = P(A) + P(B)
Which of the probability axioms can be said to be true?
II. For any event A, P(Ā) = 1 - P (A)
III. For any two events A and B, P(A,B) = P(A) + P(B)
Which of the probability axioms can be said to be true?
Seçenekler
A
Only I
B
Only II
C
I and II
D
I and III
E
II and III
Açıklama:
I. For any event A⊆S, P(A)≥0. (True)
II. For any event A, P(Ā) = 1 - P (A) (True)
III. For any two events A and B, P(A,B) = P(A) + P(B) (False, For any two events A and B, P(A,B) = P(A) + P(B) - P(A+B) )
The answer is C.
II. For any event A, P(Ā) = 1 - P (A) (True)
III. For any two events A and B, P(A,B) = P(A) + P(B) (False, For any two events A and B, P(A,B) = P(A) + P(B) - P(A+B) )
The answer is C.
Soru 37
I. P(AnB) = P(A⏐B)P(B) this formula is called the multiplication rule.
II. A and B are statistically independent if and only if P(AnB) = P(A)P(B).
III. For A and B sets independence can also be denoted by P(A⏐B)
II. A and B are statistically independent if and only if P(AnB) = P(A)P(B).
III. For A and B sets independence can also be denoted by P(A⏐B)
Seçenekler
A
Only I
B
Only II
C
I and II
D
I and III
E
II and III
Açıklama:
I. P(AnB) = P(A⏐B)P(B) this formula is called the multiplication rule. (True)
II. A and B are statistically independent if and only if P(AnB) = P(A)P(B). (True)
III. For A and B sets independence can also be denoted by P(A⏐B). (False, P(A⏐B) denotes conditional probability for sets A and B.)
The answer is C.
II. A and B are statistically independent if and only if P(AnB) = P(A)P(B). (True)
III. For A and B sets independence can also be denoted by P(A⏐B). (False, P(A⏐B) denotes conditional probability for sets A and B.)
The answer is C.
Soru 38
Which of the following terms define the set of all possible outcomes in a random experiment?
Seçenekler
A
Sample space
B
Elementary outcome
C
Basic outcomes
D
Event
E
Subset of a sample
Açıklama:
The set of all possible outcomes of a random experiment is called the sample space.
Soru 39
A random experiment is any process that leads to two or more possible outcomes, without knowing exactly which outcome will occur. Which one below is NOT an example of a random experiment?
Seçenekler
A
Rolling a fair die
B
Customers arriving at a particular store during some time interval.
C
Airplanes taking off in a given time interval at some airport.
D
The students in the biggest classroom at school.
E
Some particular customer requests in a bank.
Açıklama:
A random experiment is any process that leads to two or more possible outcomes, without knowing exactly which outcome will occur.
For example, when a fair die is rolled we know that one of the six faces will show up but we will not be able to say exactly which face will actually show up. Thus, rolling a fair die is an example of a random experiment. Some further examples of random experiments are:
For example, when a fair die is rolled we know that one of the six faces will show up but we will not be able to say exactly which face will actually show up. Thus, rolling a fair die is an example of a random experiment. Some further examples of random experiments are:
- Customers arriving at a particular store during some time interval.
- Airplanes taking off in a given time interval at some airport.
- Some particular customer requests in a bank.
Soru 40
Seçenekler
A
A and B are closely related two events
B
The events A and B intersects
C
A and B are mutually exclusive
D
A and B are complementary events
E
A and B are union of events
Açıklama:
If A and B are any two events then they are said to be mutually exclusive. The above equation shows this.
Soru 41
Which of the statements below are correct?
I In classical probability, all the outcomes have the same chance of happening.
II In empirical probability, the experiments are repeated many times and the observed outcomes of the event we are interested in is counted.
III When it is not possible to observe the outcomes of events, the researcher applies the researcher assigns a suitable value as the probability of the event.
IV It is not appropriate to use personal judgement to assign the probability.
Seçenekler
A
I and II
B
II and III
C
II, III and IV
D
I, II and III
E
II, III and IV
Açıklama:
In the classical probability approach to assign a probability to an event, the assumption is that all the outcomes have the same chance of happening.
The empirical probability uses the relative frequencies to assign the probabilities to the events. The empirical probability is based on experiments. In order to find the probability of a specific event, the experiments are repeated many times and the observed outcomes of the event we are interested in is counted.
Sometimes it may not possible to observe the outcomes of events; therefore, the researcher may assign a probability to an event. In subjective probability approach, the researcher assigns a suitable value as the probability of the event. Therefore, a personal judgement comes in to play to assign the probability. This approach is not favorable method to assign probability, but sometimes if there is no previous knowledge on the subject then the researcher may assign a subjective probability as a starting point. Once enough information about the probability of the event is collected then the researcher may revise this initial subjective probability.
Soru 42
A engineer wants to choose the best company to work for. Before choosing the company, he classifies the companies according to their location and salary offered. There are 12 different locations and 10 different salaries. In how many different ways can companies be classified?
Seçenekler
A
22
B
220
C
2200
D
120
E
1200
Açıklama:
Consider any two experiments of which the first experiment can result in n1 and the second can result in n2 possible outcomes. Then, considering both experiments together, there are n1n2 possible outcomes. This principle can also be generalized to a finite number of experiments.
According to the basic principle of counting, it follows that there are in total 10.12=120 different possible classifications.
According to the basic principle of counting, it follows that there are in total 10.12=120 different possible classifications.
Soru 43
2 models will be selected to walk in a fashion show in France. There are 2 models from an Italian agency and 3 of them work for a Turkish agency. how many different possible outcomes are there?
Seçenekler
A
4
B
5
C
6
D
7
E
10
Açıklama:
Let us denote the Italian models by X1 and X2, the Turkish models by Y1, Y2, and Y3. Then, there
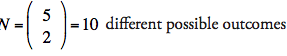
Soru 44
2 models will be randomly selected to walk in a fashion show in France. There are 2 models from an Italian agency and 3 of them work for a Turkish agency. If the event “one Turkish model Y and one Italian model X is chosen” is denoted by E, which one below is the listing the elements of E?
Seçenekler
A
E= {X1X2, Y1Y2, Y1Y3, Y2Y3, X1Y1, X1Y2, X1Y3, X2Y1, X2Y2, X2Y3}
B
E = { X1Y1, X1Y2, X1Y3, X2Y1, X2Y2, X2Y3}
C
E = { X1Y1, X1Y2, X1Y3, X2Y1, X2Y2}
D
E = { X1X1, X1Y2, X1Y3, X2Y1, X2Y2, X2Y3}
E
E = { X1Y1, X1Y2, X1Y3}
Açıklama:
E = { X1Y1, X1Y2, X1Y3, X2Y1, X2Y2, X2Y3}
Soru 45
2 models will be randomly selected to walk in a fashion show in France. There are 2 models from an Italian agency and 3 of them work for a Turkish agency. If the event “one Turkish model X and one Italian model Y is chosen” is denoted by E, what is the probability that event E occur?
Seçenekler
A
0.4
B
0.5
C
0.6
D
0.7
E
0.07
Açıklama:
There are different possible outcomes and the sample space is
S = {X1X2, Y1Y2, Y1Y3, Y2Y3, X1Y1, X1Y2, X1Y3, X2Y1, X2Y2, X2Y3}
If the event “one brand X and one brand Y phone is chosen” is denoted by E, the elements of E are .
E = { X1Y1, X1Y2, X1Y3, X2Y1, X2Y2, X2Y3}
The probability that event E will occur.
P(E)=n(E):n(S) = 6:10 =0.6
S = {X1X2, Y1Y2, Y1Y3, Y2Y3, X1Y1, X1Y2, X1Y3, X2Y1, X2Y2, X2Y3}
If the event “one brand X and one brand Y phone is chosen” is denoted by E, the elements of E are .
E = { X1Y1, X1Y2, X1Y3, X2Y1, X2Y2, X2Y3}
The probability that event E will occur.
P(E)=n(E):n(S) = 6:10 =0.6
Soru 46
When the occurrence or non-occurrence of an event A does not affect the occurrence of another event B, then we say that A and B are statistically ........ events?
Seçenekler
A
irrelevant
B
codependent
C
independent
D
dependent
E
random
Açıklama:
When the occurrence or non-occurrence of an event A does not affect the occurrence of another event B, then we say that A and B are statistically independent events.
Soru 47
Let E1, E2, ..., Ek be a collection of mutually exclusive and collectively exhaustive events. Then for any event A with P(A)≠0 and any i=1, 2..., k
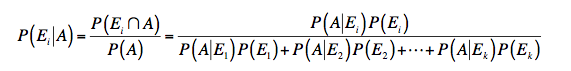 What is the formula above?
What is the formula above?Seçenekler
A
Multiplication rule
B
Bayes’ Theorem
C
Random experiment
D
Elementary outcome
E
Independence probability
Açıklama:
An important application of conditional probability is given in the following result, which is known as Bayes’ Theorem.
Let E1, E2, ..., Ek be a collection of mutually exclusive and collectively exhaustive events. Then for any event A with P(A)≠0 and any i=1, 2..., k
P(Ei A)=P(Ei∩A)= P(AEi)P(Ei)
P (A) P (A E1 )P (E1 )+ P (A E2 )P (E2 )+!+ P (A Ek )P (Ek )
Let E1, E2, ..., Ek be a collection of mutually exclusive and collectively exhaustive events. Then for any event A with P(A)≠0 and any i=1, 2..., k
P(Ei A)=P(Ei∩A)= P(AEi)P(Ei)
P (A) P (A E1 )P (E1 )+ P (A E2 )P (E2 )+!+ P (A Ek )P (Ek )
Soru 48
For two sets A and B the probability of A is 0.15 and the probability of B is 0.25 if P(A|B) is equal to 0.30 what is the value of P(B|A)?
Seçenekler
A
0.05
B
0.10
C
0.125
D
0.18
E
0.5
Açıklama:
According to the Bayes's Theorem P(B|A) is equal to [P(A|B)*P(B)]/P(A). The values are given as so P(A|B)=0.30, P(B)=0.25 and P(A)=0.15. P(B|A)=(0.30*0.25)/(0.15) = 0.5. The answer is E.
Soru 49
For two sets A and B the probability of B is 0.45 and P(A|B) is equal to 0.20 what is the value of P(A∩B)?
Seçenekler
A
2.25
B
0.90
C
0.44
D
0.10
E
0.09
Açıklama:
According to the multiplication rule P(A∩B) = P(A⏐B)*P(B). The values are given as P(B)=0.45 and P(A⏐B)=0.20. P(A∩B) = (0.45)*(0.20) = 0.09. The answer is E.
Soru 50
What is the probability of two dices landing on numbers that when sum up is equal to 6?
Seçenekler
A
1/6
B
1/12
C
5/6
D
5/36
E
2/6
Açıklama:
For two dices the total number of possible outcomes is equal to 6*6 = 36. For the numbers' sum to be equal to 6 the number has to be (1,5), (2,4), (3,3), (4,2), (5,1) which shows that the number of times the event happening is equal to 5. The probability of two dices landing on numbers that when sum up is equal to 6 is 5/36. The answer is D.
Soru 51
Which is NOT TRUE about a random experiment?
Seçenekler
A
It is any process that leads to two or more possible outcomes
B
We are able to know which outcome will occur
C
We are able to list or describe all of the possible outcomes
D
The set of all possible outcomes is important to understand
E
Its set of all possible outcomes is called the sample space
Açıklama:
A random experiment is any process that leads to two or more possible outcomes, without knowing exactly which outcome will occurIn a random experiment, Although we do not know which outcome will occur, we are able to list or describe all of the possible outcomes. The set of all possible outcomes is important to understand the random experiment. Therefore, it is called a sample space, which is restated below as a definition.
Soru 52
Which is TRUE aboout the classical probability?
Seçenekler
A
Uses the relative frequencies to assign the probabilities to the events
B
It is based on experiments
C
The assumption is that the outcomes have the same chance of happening
D
The researcher assigns a suitable value as the probability of the event.
E
A personal judgement comes in to play to assign the probability.
Açıklama:
In the classical probability approach to assign a probability to an event, the assumption is that all the outcomes have the same chance of happening. Pick up a six-sided fair die, there are six numbers on each face of the die as 1, 2, 3, 4, 5, and 6. Classical probability says that each side of the die has the same chance to come face up if this die is thrown. Since there are 6 possible outcomes of throwing a six-sided fair die probability of obtaining any number represented on the faces of this six-sided fair die is 1/6.
Soru 53
We have a box containing only red and blue balls. If we randomly pick up a ball from this box, it could only be either a red ball or a blue ball, the selected ball cannot be a ball of red and blue at the same time. The occurrence of one event dictates that none of the other events can occur at the same time.
How is this event called?
How is this event called?
Seçenekler
A
Multiplication rule
B
Statistically independent
C
Empirical probability
D
Subjective Probability
E
Mutually exclusive
Açıklama:
In probability, if the occurrence of one event dictates that none of the other events can occur at the same time, we call this event mutually exclusive events.
Soru 54
In a study about employess, employees are classified according to the department they work in and their preference of training coursec. If there are 12 different departments and 7 different courses, in how many different ways can an employee be classified?
Seçenekler
A
72
B
19
C
84
D
12
E
7
Açıklama:
In a study about college students, students are classified according to their department and preference of language course. If there are 10 different departments and 5 different language courses, in how many different ways can a student be classified? According to the basic principle of counting, it follows that there are in total 10.5=50 different possible classifications.
In a study about employess, employees are classified according to the department they work in and their preference of training courses. If there are 12 different departments and 7 different courses, according to the basic principle of counting, itf ollows that there are in total 12.7=84 different possible classifications.
In a study about employess, employees are classified according to the department they work in and their preference of training courses. If there are 12 different departments and 7 different courses, according to the basic principle of counting, itf ollows that there are in total 12.7=84 different possible classifications.
Soru 55
How many different ordered arrangements of the four letters W,X, Y and Z are there?
Seçenekler
A
12
B
4
C
48
D
24
E
6
Açıklama:
When order is important, we call the arrangements of a finite number of distinct objects a permutation. For example, there are a total of 3!=6 different ordered arrangements of the three letters A,B, and C. If there are four letters (W,X,Y,Z) there are a total of 4!=24 different ordered arrangements.
Soru 56
How many different ways can the letters in the word COMMON be arranged?
Seçenekler
A
6
B
180
C
360
D
120
E
720
Açıklama:
This is a permutation with repeated items. If all the seven letters in the given word were different, the total number of arrangements would be 6!. Since all the arrangements of the two letters C1 and C2 , and all the arrangements of the two letters M1 and M2 should be counted only once, it follows that the answer is: 6!/2!2!=180
Soru 57
We know that event B has occurred and we are interested in finding the probability of event A. In other words, we are interested in finding the probability of A knowing that event B has occurred. Which of the following formula denotes the probability? We know that event B has occurred and we are interested in finding the probability of event A. In other words, we are interested in finding the probability of A knowing that event B has occurred. Which of the following formula denotes the probability?
Seçenekler
A
P(A∩B) = P(A⏐B)P(B)
B
P(A∩B) = P(A⏐B)P(A)
C
P(A∩B) = P(A⏐B)
D
P(A∩B) P(A)= P(A⏐B)
E
P(A∩B) = P(A⏐B)P(B)P(A)
Açıklama:
We know that event B has occurred and we are interested in finding the probability of event A. That is, we are interested in finding the probability of A knowing that event B has occurred.The formula for this is as follows: P(A∩B) = P(A⏐B)P(B)
Soru 58
There are 36 cards in a box with three different colors-6 yellow, 12 blue, 18 red. What is the probability of obtaining two yellow cards when randomly drawing two cards?
Seçenekler
A
1/42= 0.02381
B
5/216 = 0.02315
C
1/35 = 0.02857
D
4/35 = 0.11429
E
9/35 = 0.25714
Açıklama:
This is how we formulate the probability: P(A1∩ A2 ) = P(A2|A1 )P(A1 ) = P(A1 )P(A2|A1 )
This is how we calculate the probability of drawing two yellow cards: 6/36.5/35=1/42= 0.02381
This is how we calculate the probability of drawing two yellow cards: 6/36.5/35=1/42= 0.02381
Soru 59
Which of the following is a feature of Bayes’ Theorem?
I.Using Bayes’ Theorem, we can find the probability that a defective item is produced by a particular machine.
II.It enables us to compute a particular conditional probability.
III. It is defined as the arrangements of a finite number of distinct objects.
I.Using Bayes’ Theorem, we can find the probability that a defective item is produced by a particular machine.
II.It enables us to compute a particular conditional probability.
III. It is defined as the arrangements of a finite number of distinct objects.
Seçenekler
A
I, III
B
II
C
III
D
I, II
E
I
Açıklama:
Bayes’ Theorem is an important application of conditional probability. This theorem enables us to compute a particular conditional probability. Using Bayes’ Theorem, we can find the probability that a defective item is produced by a particular machine,
Soru 60
What is the formula P(A∩B) = P(A⏐B)P(B) called?
Seçenekler
A
Classical Probability
B
Empirical Probability
C
Subjective Probability
D
Multiplication rule
E
Bayes’ Theorem
Açıklama:
Suppose that we know that event B has occurred and we are interested in finding the probability of event A. That is, we are interested in finding the probability of A knowing that event B has occurred. The formula specified is actually called the multiplication rule and has important applications.
Soru 61
According to classical probability approach, what is the probability of obtaining a number less than 3 if we throw a six-sided fair die?
Seçenekler
A
0.167
B
0.267
C
0.333
D
0.467
E
0.567
Açıklama:
Remember on a six-sided fair die, all the outcomes have the same chance to appear, in this example the question makes a restriction of observing values less than 3. There are only two outcomes to satisfy this restriction; those are the numbers 1, and 2; therefore, the probability we are looking for is
P(less than 3) = 2/6 = 1/3 = 0.333
P(less than 3) = 2/6 = 1/3 = 0.333
Ünite 7
Soru 1
Which of the following is a discrete random variable?
Seçenekler
A
A time that is spent to complete a task
B
The weight of a newborn baby
C
The height of randomly selected students in a classroom
D
The number of arrivals at an emergency room between midnight and 6:00 a.m.
E
The duration of the next outgoing telephone call from a business office.
Açıklama:
Discrete random variables have only a countable number of separate values such as 0, 1, 2 , 3... etc. For example, the number of students in a class for certain day or the number of customers in a supermarket after 5:00 PM are cases for discrete random variables since these variables are finite and countable. Conversely, continuous random variable can take entire infinite values in a given interval. Because of this reason, continuous random variables are commonly measured instead of counted. For instance, waiting time for customers in a supermarket cashier line and travel time of a bus between two points are examples for continuous random variables. The correct answer is D.
Soru 2
Which of the following is a continuous random variable?
Seçenekler
A
The number of new cases of influenza in a particular city in a month
B
The number of accident-free days in a year at a building site
C
The amount of rain recorded at an airport in a week
D
The number of passengers in a bus on a highway at rush hour
E
The number of clerical errors on a medical chart
Açıklama:
Discrete random variables have only a countable number of separate values such as 0, 1, 2 , 3... etc. For example, the number of students in a class for certain day or the number of customers in a supermarket after 5:00 PM are cases for discrete random variables since these variables are finite and countable. Conversely, continuous random variable can take entire infinite values in a given interval. Because of this reason, continuous random variables are commonly measured instead of counted. For instance, waiting time for customers in a supermarket cashier line and travel time of a bus between two points are examples for continuous random variables. The correct answer is C.
Soru 3
I. The air pressure on a tire on an automobile II.The number of students who actually register for classes III. The amount of liquid in a can of cola IV. The temperature of a cup of coffee Which of the variables above are examples of a continuous random variable?
Seçenekler
A
I and II
B
I, II and III
C
I and III
D
I, II ve IV
E
I, III and IV
Açıklama:
Discrete random variables have only a countable number of separate values such as 0, 1, 2 , 3... etc. For example, the number of students in a class for certain day or the number of customers in a supermarket after 5:00 PM are cases for discrete random variables since these variables are finite and countable. Conversely, continuous random variable can take entire infinite values in a given interval. Because of this reason, continuous random variables are commonly measured instead of counted. For instance, waiting time for customers in a supermarket cashier line and travel time of a bus between two points are examples for continuous random variables. The correct answer is E.
Soru 4
What is the set for the possible values of the random variable stated below?
"The number of coins that match when three coins are tossed at once."
"The number of coins that match when three coins are tossed at once."
Seçenekler
A
{1,2}
B
{2,3}
C
{0,1}
D
{0,1,2}
E
{1, 2, 3}
Açıklama:
When three coins are tossed at once, some of the possibilities of head or tail can be listed as below:
H(Head) T(Tail)
HHH
TTT
HHT
HTT
When these possibilities are taken into consideration either two or three coins may have the same match. So {2,3}
is the correct answer.
H(Head) T(Tail)
HHH
TTT
HHT
HTT
When these possibilities are taken into consideration either two or three coins may have the same match. So {2,3}
is the correct answer.
Soru 5
I. It carries a unique numerical value.
II. It is determined by random probability experiment and its associated outcome
III. In statistical notation, random variables represented by lower case such as x and y.
Which of the following statements above are TRUE for random variables?
II. It is determined by random probability experiment and its associated outcome
III. In statistical notation, random variables represented by lower case such as x and y.
Which of the following statements above are TRUE for random variables?
Seçenekler
A
I, II and III
B
I and II
C
I and III
D
Only I
E
Only II
Açıklama:
In statistical notation random variables represented by capital letters such as X,Y and so on. So number III is false. Number I and II are true. The correct answer is B.
Soru 6
"__________is a widely employed discrete probability distribution in statistics where a set of independent observations constitutes exactly two disjoint outcomes of a trial."
Which option completes the definition given above?
Which option completes the definition given above?
Seçenekler
A
Binomial Distribution
B
Cumulative Distribution
C
Standard Deviation
D
Poisson Distribution
E
Hypergeometric Distribution
Açıklama:
Binomial distribution is a widely employed discrete probability distribution in statistics where a set of independent observations constitutes exactly two disjoint outcomes of a trial. Therefore in binomial distribution, an outcome of a random experiment can be classified under two different categories. For example, when a die is tossed once we observe six different numbers, that is x = 1, 2, 3, 4, 5 and 6. If we classified these outcomes as even or odd numbers then we will get two different outcomes. Likewise we can separate the turnover of a company into two categories, such as above and below the target level. Also, we can separate the exam grades simply into two categories, satisfactory and poor. The correct answer is A.
Soru 7
"For binomial distribution, its principal assumptions are n independent trials with two possible outcomes (success or failure) for each trial, and the success probability remains constant for each trial. On the other hand __________ distribution doesn’t involve with independence assumption for each trial and accordingly the sampling process is established on without replacement. Because of these features, it is broadly used in various real life applications especially for acceptance sampling in quality control."
Choose the correct option to complete blank in the paragraph given above.
Choose the correct option to complete blank in the paragraph given above.
Seçenekler
A
Binomial
B
Poisson
C
Hypergeometric
D
Standard
E
Variance
Açıklama:
In binomial distribution, its principal assumptions are n independent trials with two possible outcomes (success or failure) for each trial, and the success probability remains constant for each trial. Therefore in binomial distribution the sampling process is carried out with replacement. On the other hand hypergeometric distribution doesn’t involve with independence assumption for each trial and accordingly the sampling process is established on without replacement. Because of these features, hypergeometric distribution is broadly used in various real life applications especially for acceptance sampling in quality control.The correct answer is C.
Soru 8
Some of the illustrations of random variables that generally conform to model by means of Poisson distribution are presented below.Which illustration does NOT conform to this model?
Seçenekler
A
The number of customers served by automated teller machine in a day.
B
The amount of time that customers spent using the automated teller machine in a day
C
The number of patients in the hospital on a given day
D
The number of diseased strawberry plants in ten acres field
E
The number of telephone calls received by a technical support center in a week.
Açıklama:
The Poisson distribution is widely used for discrete probability distribution which is used to model the number of outcomes occurring during a specified time interval or in a definite region.Option B is not a discerete random variable. It is a continuous random variable. The correct answer is B.
Soru 9
What is a central tendency measure of the probability distribution?
Seçenekler
A
Arithmetic mean
B
Standart deviation
C
Variance
D
Cumulative Distribution Function
E
Hypergeometric Distribution
Açıklama:
Arithmetic mean and variance are frequently used to summarize the features of probability distributions for a discrete random variable X. The arithmetic mean is a central tendency measure of the probability distribution and the variance is a measure of the dispersion or variability for a data set. The correct answer is A.
Soru 10
I. The time a person spends on reading a day
II. The amount of water a person drinks a day
III. The weight gain of a person in a month
Which of the variables given above are examples of a continuous random variable?
II. The amount of water a person drinks a day
III. The weight gain of a person in a month
Which of the variables given above are examples of a continuous random variable?
Seçenekler
A
Only I
B
Only II
C
I and II
D
II and III
E
I,II and III
Açıklama:
Discrete random variables have only a countable number of separate values such as 0, 1, 2 , 3... etc. For example, the number of students in a class for certain day or the number of customers in a supermarket after 5:00 PM are cases for discrete random variables since these variables are finite and countable. Conversely, continuous random variable can take entire infinite values in a given interval. Because of this reason, continuous random variables are commonly measured instead of counted. For instance, waiting time for customers in a supermarket cashier line and travel time of a bus between two points are examples for continuous random variables. The correct answer is E.
Soru 11
I. The number of students in a class.
II. The time spent on doing an assignment.
III. The height of the students.
IV. The number of laptops in a school.
Which of the variables above is an example of a discrete random variable?
II. The time spent on doing an assignment.
III. The height of the students.
IV. The number of laptops in a school.
Which of the variables above is an example of a discrete random variable?
Seçenekler
A
I and II.
B
I and IV.
C
All of them
D
None of them
E
II and III.
Açıklama:
Discrete random variables have only a countable number of separate values such as 0, 1, 2, 3... etc.
Soru 12
Which of the following is a discrete random variable?
Seçenekler
A
The sitting time interval of students in a library.
B
The weight of the books in a library.
C
The heat of a library.
D
The height of the students in a library.
E
The blood pressures of the students in a library.
Açıklama:
Discrete random variables have only a countable number of separate values such as 0, 1, 2 , 3... etc. In addition to above examples, the number of students in a class for certain day or the number of customers in a supermarket after 5:00 PM are cases for discrete random variables since these variables are finite and countable. Conversely, continuous random variable can take entire infinite values in a given interval. Because of this reason, continuous random variables are commonly measured instead of counted.
Soru 13
X=x 1 2 3 4 P(X=x) 0,20 0,25 0,30 0,30 Which of the following is the mean (μ) for the probability distribution given above?
Seçenekler
A
1
B
2
C
2,5
D
2,8
E
2,6
Açıklama:
Ux= E(X)=1.02+2.0,25+3.0,3+4.0,30=2,8
Soru 14
A support centre receives 8 calls per hour and the number of the calls follows the Poisson distribution.
Which of the following is the probability exactly 6 calls in an hour?
Which of the following is the probability exactly 6 calls in an hour?
Seçenekler
A
0,01
B
0,02
C
0,03
D
0,04
E
0,05
Açıklama:
0,01
Soru 15
I. The number of people in a mall. II. The speed of a car. III. The exam points of students in a class. Which of the variables above continuous random variable?
Seçenekler
A
I
B
I and II
C
I, II, and III
D
II and III
E
III
Açıklama:
The number of people in a mall can be countable while the other variables are measured.
Soru 16
Consider the probability distribution for the random variable X given below and determine the probability of P (1.5 < X ≤ 4) =?
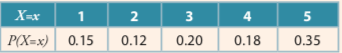
Seçenekler
A
0,4
B
0,5
C
0,35
D
0,45
E
0,70
Açıklama:
0,5
Soru 17
Which of the following is not true about binomial distribution?
Seçenekler
A
Independent observations constitute exactly two disjoint outcomes of a trial
B
An outcome of a random experiment can be classified into two different categories
C
A random experiment (trial) with only two possible outcomes is called a Bernoulli trial.
D
Binomial random variable represented as X ∼ Binomal (n, p)
E
Binominal distribution is used to model the number of outcomes occurring during a specified time interval or in a definite region
Açıklama:
The Poisson distribution is widely used for discrete probability distribution which is used to model the number of outcomes occurring during a specified time interval or in a definite region.
Soru 18
| X=x | 1 | 2 | 3 | 4 |
| P(X=x) | 0,20 | 0,30 | 0,30 | 0,20 |
Seçenekler
A
1
B
2
C
2,5
D
3
E
3,5
Açıklama:
μ = E(X) = xP(X = x), x = 1,2,3,4, = 1⋅P(X =1)+ 2⋅P(X = 2)+ 3⋅P(X = 3)+ 4 ⋅P(X = 4)
μ = E(X) = 1⋅0.20+ 2⋅0.30+ 3⋅0.30+ 4 ⋅0.20
μ = E(X) = 0.20+ 0.60+ 0.90+ 0.80 = 2.5
μ = E(X) = 1⋅0.20+ 2⋅0.30+ 3⋅0.30+ 4 ⋅0.20
μ = E(X) = 0.20+ 0.60+ 0.90+ 0.80 = 2.5
Soru 19
| X=x | 1 | 2 | 3 | 4 |
| P(X=x) | 0,20 | 0,30 | 0,30 | 0,20 |
Seçenekler
A
4
B
4.25
C
4.15
D
4.20
E
4.50
Açıklama:
E(X2) = 12P(X =1)+ 22⋅P(X = 2)+ 32⋅P(X = 3)+ 42⋅P(X = 4)
E(X2) = 1⋅0.20+ 4 ⋅0.30+ 9⋅0.30+16⋅0.40 = 10.50
σ 2=V(X) = E(X2)−[E(X)]2=10.50 − (2.5)2= 4.25
E(X2) = 1⋅0.20+ 4 ⋅0.30+ 9⋅0.30+16⋅0.40 = 10.50
σ 2=V(X) = E(X2)−[E(X)]2=10.50 − (2.5)2= 4.25
Soru 20
| X=x | 1 | 2 | 3 | 4 |
| P(X=x) | 0,20 | 0,30 | 0,30 | 0,20 |
Seçenekler
A
1.9
B
1.95
C
2
D
2.015
E
2.0615
Açıklama:
σ= 2.0615
Soru 21
Which of the following is a discrete random variable?
Seçenekler
A
The rainfall in a area over years
B
Waiting time in a phone banking system
C
Length of trees in a certain forest
D
The water level in a certain river during a year
E
Number of students taking statistics course over years
Açıklama:
Things measured by time, volume, length, height etc are type of contionus variables, but things meauser by numbers are discrete. However, number of students taking a course can be measured only in integers so it's a discrete variable.
Soru 22
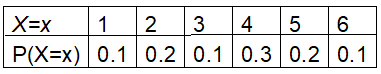 What will be the probability P(2.5
Seçenekler
A
0.1
B
0.2
C
0.3
D
0.4
E
0.6
Açıklama:
P(2.5
Soru 23
What is the mean of variable X, given the probabilty distribution above?Seçenekler
A
3
B
3.2
C
3.4
D
3.5
E
3.6
Açıklama:
Mean=Sum(X.P(X=x))=(1*0.1)+(2*0.2)+(3*0.1)+(4*0.3)+(5*0.2)+(6*0.1)
=0.1+0.4+0.3+1.2+1+0.6=3.6
=0.1+0.4+0.3+1.2+1+0.6=3.6
Soru 24
Which one is broadly used in various real life applications especially for acceptance sampling in quality control?
Seçenekler
A
Hypergeometric distribution
B
Binomial distribution
C
Poisson distribution
D
Arithmetic mean
E
Cumulative distribution
Açıklama:
This probability is called Hypergeometric distribution.The correct answer is A.
Soru 25
What is mean score?
Seçenekler
A
The most frequent score in a data set
B
The gap between the lowest and the highest score
C
The difference between a certain score and the average
D
The score obtained by dividing the total scores by the number of scores
E
Scores which are turned into zvalue
Açıklama:
You get the mean score if you divide the total scores by the number of scores.So the correct answer is D.
Soru 26
What is mode?
Seçenekler
A
The most frequent score in a data set
B
The gap between the lowest and the highest score
C
The difference between a certain score and the average
D
The score optained by dividing the total scores by the number of scores
E
Scores which are turned into zvalue
Açıklama:
Mode is the most frequently appearing score in a data set.So the correct answer is A.
Soru 27
What is the variance of the probability distribution given above?
Seçenekler
A
3.62
B
3.20
C
3
D
2.24
E
1.68
Açıklama:
We have to first compute the mean of the distribution in order to calculate the variance.
Mean=Sum(X.P(X=x))=(1*0.1)+(2*0.2)+(3*0.1)+(4*0.3)+(5*0.2)+(6*0.1)
=0.1+0.4+0.3+1.2+1+0.6=3.6
Variance=Sum[ P(X)*(X-Mean)2 ]=0.1*(1-3.6)2+0.2*(2-3.6)2+0.1*(3-3.6)2+0.3*(4-3.6)2+0.2*(5-3.6)2+0.1*(6-3.6)2=2.24
Mean=Sum(X.P(X=x))=(1*0.1)+(2*0.2)+(3*0.1)+(4*0.3)+(5*0.2)+(6*0.1)
=0.1+0.4+0.3+1.2+1+0.6=3.6
Variance=Sum[ P(X)*(X-Mean)2 ]=0.1*(1-3.6)2+0.2*(2-3.6)2+0.1*(3-3.6)2+0.3*(4-3.6)2+0.2*(5-3.6)2+0.1*(6-3.6)2=2.24
Soru 28
Find out the mean score of the following data set: 10,20,40,60,100?
Seçenekler
A
42
B
43
C
44
D
45
E
46
Açıklama:
The answer is E)46 as : The total scores are 230 and when we divide 230 by 5 we get 46
Soru 29
Find out the mode in the following data set: 30, 30, 40,40 50,50,65,65,80,80,80
Seçenekler
A
30
B
40
C
50
D
65
E
80
Açıklama:
The correct answer is E because it appears three times.
Soru 30
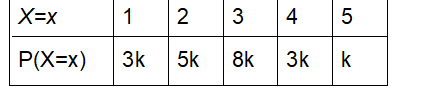 What must be the value of k if the table above is a probability distribution table of variable X?
Seçenekler
A
0.02
B
0.03
C
0.05
D
0.06
E
0.10
Açıklama:
The sum of all probabilities must be equal to 1, if it is a probability distribution table. Thus 3k+5k+8k+3k+k=20k=1 then k=1/20=0.05
Soru 31
What is range?
Seçenekler
A
The most frequent score in a data set
B
The gap between the lowest and the highest score
C
The difference between a certain score and the average
D
The score optained by dividing the total scores by the number of scores
E
Scores which are turned into zvalue
Açıklama:
Range is the difference between the lowest and the highest score in a data set that's why the correct answer is B.
Soru 32
Find out the range in the following data set: 10,15,20,25,30,35,40,45,50,55,60
Seçenekler
A
50
B
51
C
52
D
53
E
54
Açıklama:
The difference between 60(the highest) and 10(the lowest) is 50 so the correct answer is A
Soru 33
Which one can be defined as a rule that assigns probabilities to the values of random variables?
Seçenekler
A
Hypergeometric distribution
B
Binomial distribution
C
Poisson distribution
D
Probability distribution
E
Cumulative distribution
Açıklama:
We can define probability distribution as a rule that assigns probabilities to the values of random variables.So the correct answer is D.
Soru 34
Which one is frequently used to summarize the features of probability distributions for a discrete random variable X?
Seçenekler
A
Hypergeometric distribution
B
Binomial distribution
C
Arithmetic mean and variance
D
Probability distribution
E
Cumulative distribution
Açıklama:
Arithmetic mean and variance are frequently used to summarize the features of probability distributions for a discrete random variable X .So the correct answer is C
Soru 35
Which one is a widely employed discrete probability distribution in statistics where a set of independent observations constitutes exactly two disjoint outcomes of a trial?
Seçenekler
A
Hypergeometric distribution
B
Binomial distribution
C
Poisson distribution
D
Probability distribution
E
Cumulative distribution
Açıklama:
Binomial distribution is a widely employed discrete probability distribution in statistics where a set of independent observations constitutes exactly two disjoint outcomes of a trial.So the correct answer is B.
Soru 36
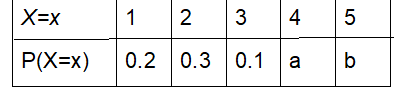 What must be the value of "a" if the table above is the probability distribution of variable X whose mean is 2.8?
Seçenekler
A
0.1
B
0.2
C
0.3
D
0.4
E
0.5
Açıklama:
If this is a probabilty distribution than the sum of all probabilities must be equal to 1. Thus 0.2+0.3+0.1+a+b=1 which means a+b=0.4, thus b=0.4-a. Also it is given that the mean of X is equal to 2.8.
Mean=Sum((X=x)P(X=x))
2.8=(1*0.2)+(2*0.3)+(3*0.1)+(4*a)+(5*b)
2.8=1.1+4a+5b
1.7=4a+5b=4a+5(0.4-a)
1.7=2-a
0.3=a
Mean=Sum((X=x)P(X=x))
2.8=(1*0.2)+(2*0.3)+(3*0.1)+(4*a)+(5*b)
2.8=1.1+4a+5b
1.7=4a+5b=4a+5(0.4-a)
1.7=2-a
0.3=a
Soru 37
There are 6 red and 4 blue balls in a box. One randomly chooses 4 balls from the box without replacing it. What is the probability of choosing at most 1 red ball out of these 4 balls?
Seçenekler
A
0.12
B
0.18
C
0.24
D
0.36
E
0.48
Açıklama:
We have to compute zero red balls and 1 red ball.
P(x=0)=C(4,0)*0.60*0.44=0.44
P(x=1)=C(4,1)*0.61*0.43=2.4*0.43
P(x=0)+P(x=1)=2.4*0.43+0.44=0.43(2.4+0.4)=2.8*0.43=0.1792=0.18
P(x=0)=C(4,0)*0.60*0.44=0.44
P(x=1)=C(4,1)*0.61*0.43=2.4*0.43
P(x=0)+P(x=1)=2.4*0.43+0.44=0.43(2.4+0.4)=2.8*0.43=0.1792=0.18
Soru 38
If one wants to model the number of customers entering to a fast food restaurant per hour, which probability distribution should he/she use?
Seçenekler
A
Poisson
B
Binomial
C
Hypergeometric
D
Continious
E
Bernoulli
Açıklama:
Poisson distribution is suitable for modelling the number of outcomes occurring during a specified time interval or in a definite region. Here, the time interval indicates any length, for instance an hour, a day, or a month.
Soru 39
A call center receives, on average, 6 calls per minute and number of calls follows a Poisson distribution. What is the probability of receiving at most 2 calls at a given minute?
Seçenekler
A
0.062
B
0.044
C
0.028
D
0.014
E
0.006
Açıklama:
We have to compute P(x=0)+P(x=1)+P(x=2) in order to find the probability of at most 2 calls at a given minute.
P(x=0)=(e-6*60)/0!=0.00248
P(x=1)=(e-6*61)/1!=0.0149
P(x=2)=(e-6*62)/2!=0.0446
Thus P(x=0)+P(x=1)+P(x=2)=0.06198
P(x=0)=(e-6*60)/0!=0.00248
P(x=1)=(e-6*61)/1!=0.0149
P(x=2)=(e-6*62)/2!=0.0446
Thus P(x=0)+P(x=1)+P(x=2)=0.06198
Soru 40
What is the probability of flipping a coin 3 times but getting no head at all?
Seçenekler
A
1/4
B
1/8
C
1/16
D
1/32
E
1/64
Açıklama:
We have to find the probabilty of getting 3 tails but no head. Thus the probabilty of TTT=(1/2)*(1/2)*(1/2)=1/8
Soru 41
____________________ random variables have only a countable number of separate values such as 0, 1, 2 , 3... etc.Which of the following fills in the blank above?
Seçenekler
A
Continuous
B
Ratio
C
Interval
D
Discrete
E
Distinct
Açıklama:
Discrete random variables have only a countable number of separate values such as 0, 1, 2 , 3... etc.
Soru 42
The _______________ of a discrete random variable is a list of odds associated with each of its possible values.Which of the following is appropriate for filling in the blank above?
Seçenekler
A
ratio
B
probability distribution
C
continuous distribution
D
sum distribution
E
elevated ratio distribution
Açıklama:
The probability distribution of a discrete random variable is a list of odds associated with each of its possible values. It is also called the probability function or the probability mass function. Basically we can define probability function as a rule that assigns probabilities to the values of random variables.
Soru 43
In a discrete probability distribution, The sum of the probabilities of each outcome of the random variable must equal to ___________ ?
Seçenekler
A
0.1
B
0.4
C
0.7
D
0.9
E
1
Açıklama:
The sum of the probabilities of each outcome of the random variable must equal to 1.
Soru 44
Let's assume that three perfect coins are flipped three times, what is the probability that all the results are head?
Seçenekler
A
2/9
B
3/8
C
2/4
D
1/8
E
1/16
Açıklama:
The sample space is
S = {(TTT), (TTH), (THT), (HTT), (THH), (HTH), (HHT), (HHH)}
only once all the results are head, therefore
P(all head) = 1/ 8
S = {(TTT), (TTH), (THT), (HTT), (THH), (HTH), (HHT), (HHH)}
only once all the results are head, therefore
P(all head) = 1/ 8
Soru 45
Study the following discrete probability distribution:
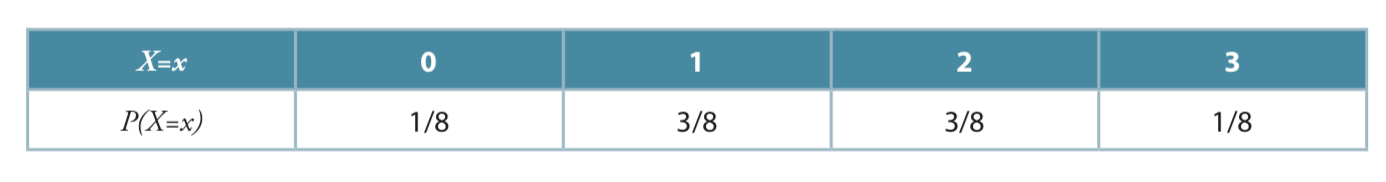 According to table what is the probability that the result is equal to 2 or less?
Seçenekler
A
3/8
B
1/8
C
2/8
D
7/8
E
8/8
Açıklama:
the result is the total of the following probabilities:
1/8 + 3/8 + 3/8 = 7/8
1/8 + 3/8 + 3/8 = 7/8
Soru 46
According to the following cumulative distribytion function graph, what is the probability of x < -1?
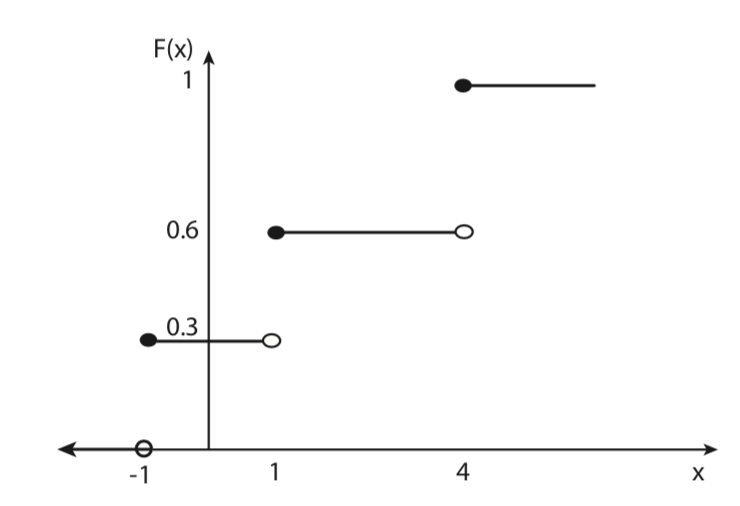
Seçenekler
A
0.5
B
0.4
C
0.3
D
0.1
E
0
Açıklama:
It will be zero.
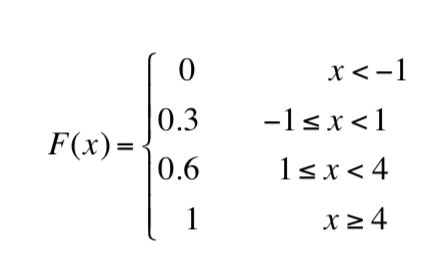
Soru 47
What is the arithmetic mean of the following discrete probablity distribution?
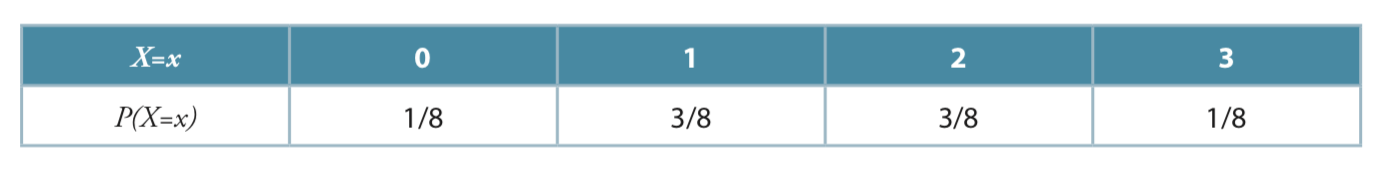
Seçenekler
A
0.50
B
0.75
C
1.25
D
1.75
E
2.25
Açıklama:
Soru 48
In ______________ distribution, an outcome of a random experiment can be classified under two different categories.
Seçenekler
A
Poisson
B
Normal
C
t
D
Binomial
E
Geometric
Açıklama:
in binomial distribution, an outcome of a random experiment can be classified under two different categories.
Soru 49
In binomial distribution, "The probability of success, denoted by and the probability of failure, denoted by remains _____________ for all trials"?
Seçenekler
A
different
B
changes trial to trial
C
constant
D
variable
E
fluctuates
Açıklama:
The probability of success, denoted by and the probability of failure, denoted by remains constant for all trials
Soru 50
In Binomial distribtuion, Each trial has only_________ possible outcomes?
Seçenekler
A
One
B
Two
C
Three
D
Four
E
Five
Açıklama:
Each trial has only two possible outcomes, such as head and tail, 0 and 1 or success and failure.
Ünite 8
Soru 1
Which of the following can be categorized as a discrete random variable?
Seçenekler
A
Water consumption in a company
B
The speed of a car in a certain area
C
Weighs of a people in a population
D
Electricity consumption of a house
E
The number of students in a class
Açıklama:
While all variables can take real numbers in other options, the number of the students cannot take a real number in option E. That is the number of students in a class can only take uncountable numbers.
Soru 2
Which of the followings are not correct related to probability density function?
Seçenekler
A
In order to calculate the area under a probability function between two points by utilizing probability density function, f (x).
B
The probability density function f (x), defines the physical characteristics of the random variable.
C
The probability density function determines the shape of the distribution for the continuous random variable X.
D
The area under the probability density function f (x) is always equivalent to 3.
E
Probability density function is represented by f (x).
Açıklama:
Because of the probability density function must satisfy the rule: ∫∞ f(x)dx=1,
the area under the probability density function f (x) is always equivalent to 1
the area under the probability density function f (x) is always equivalent to 1
Soru 3
Which of the followings is not true about cumulative distribution function?
Seçenekler
A
Cumulative distribution function defined as F(x)=P(X≤x)= ∫x f(t)dt,−∞
B
The cumulative distribution function probability supplies values by utilizing probability density function.
C
Cumulative distribution function f(x) of a continuous random variable X fulfils the following property; f(x)≥0 for all x.
D
Cumulative distribution function f(x) of a continuous random variable X fulfils the following property; if x1 ≤ x2 then F (x1) ≤ F (x2).
E
Cumulative distribution function f(x) of a continuous random variable X fulfils the following property; 0 ≤ F (x) ≤ 1.
Açıklama:
Not cumulative distribution function but probability density function fulfils the property of f(x)≥0 for all x.
Soru 4
Which of the followings is not true about normal distribution?
Seçenekler
A
Normal distribution is one of the most significant and extensively used continuous probability distribution.
B
Normal distribution provides basis for the statistical inference.
C
Normal distribution was developed by a mathematician Karl Friedrich Gauss.
D
Normal distribution is an asymmetric distribution where the random variable values are uniformly scattered around the mean.
E
Normal distribution can be called as “bell curve” or “Gaussian curve”.
Açıklama:
Normal distribution is a symmetric distribution where the random variable values are uniformly scattered around the mean.
Soru 5
Which of the following properties is not valid related to probability density function f (x) for normal distribution?
Seçenekler
A
If x1 ≤ x2 then F (x1) ≤ F (x2)
B
∫∞ f(x)dx=1
C
The normal distribution function curve is symmetric around the mean, μ.
D
The probability density function f (x) does not the touch and intersect x axis.
E
f (x) ≥ 0 for all x values.
Açıklama:
The property of "If x1 ≤ x2 then F (x1) ≤ F (x2)" is not valid related to probability density function f (x) for normal distribution because it is the property of Cumulative Density Function F(x) of a continuous random variable X.
Soru 6
Probability density function for continuous random variable X is defined as follows;
f(x) = 0.02, for 0 ≤ x ≤ 50
Which of the following mean of the continuous random variable X?
f(x) = 0.02, for 0 ≤ x ≤ 50
Which of the following mean of the continuous random variable X?
Seçenekler
A
25
B
50
C
60
D
80
E
150
Açıklama:
μ=E(X)= ∫xf(x)dx= ∫(0.02x)dx=25
Soru 7
Probability density function f (x) of normal distribution has the following property;
f (x) ≥ 0 for all x values
Which of the statements explains the property above?
f (x) ≥ 0 for all x values
Which of the statements explains the property above?
Seçenekler
A
Probability density function of random variable x obtain the non-negative values
B
The area under the probability density function f (x) always equivalent to 1 in the definition interval of the random variable X.
C
Normal distribution curve has a similar shape on both sides of the mean x=μ.
D
The tails of the probability function goes to infinity and at no time crosses or touches the x axis.
E
P (X < μ ) = P (X > μ ) =0.5.
Açıklama:
First property assures that probability density function of random variable x obtain the non-negative values at all times. From the shape of the probability density function curve it’s obvious that pdf, f (x) decreases as the random variable value goes away from the mean, μ. Likewise, probability density functionf (x) increases as the random variable value gets closer to the mean, μ.
Soru 8
Probability density function for continuous random variable X is defined as follows;
f (x) = 0.05, for 0 ≤ x ≤ 30.
Which of the following is the standard deviation of this function?
f (x) = 0.05, for 0 ≤ x ≤ 30.
Which of the following is the standard deviation of this function?
Seçenekler
A
14,08
B
14,06
C
14,05
D
15,07
E
14,03
Açıklama:
μ=E(X)= ∫xf(x)dx
σ2 =V(x)=E(X−μ)2 = ∫(x−μ)2 f(x)dx= ∫x2 f(x)dx−μ2
The standard deviation of random variable X is a square root of variance= 14.03
σ2 =V(x)=E(X−μ)2 = ∫(x−μ)2 f(x)dx= ∫x2 f(x)dx−μ2
The standard deviation of random variable X is a square root of variance= 14.03
Soru 9
An eye doctor’s physical examination time is exponentially distributed with a mean of 25 minutes
Which of the following is the probability that the physical exam duration takes less than 20 minutes?
Which of the following is the probability that the physical exam duration takes less than 20 minutes?
Seçenekler
A
0,33
B
0,44
C
0,55
D
0,66
E
0,77
Açıklama:
In this problem exponential random variable X represents the physical examination time. Also, the mean μ = 25 minutes of the physical examination time, therefore
λ=1= 1 =0.04μ 25
The probability density function is as follows,
f (x) = (0.04) e-0.04x, x ≥ 0
Therefore X ~ Exponential (λ = 0.04) and to find the probability that the physical exam duration takes less than 20 minutes P (X < 20).
P(X<20)= ∫20=(0.04)e−0.04xdx=−e−0.04x 20 =−(e−0.8 −1)=0.5500
λ=1= 1 =0.04μ 25
The probability density function is as follows,
f (x) = (0.04) e-0.04x, x ≥ 0
Therefore X ~ Exponential (λ = 0.04) and to find the probability that the physical exam duration takes less than 20 minutes P (X < 20).
P(X<20)= ∫20=(0.04)e−0.04xdx=−e−0.04x 20 =−(e−0.8 −1)=0.5500
Soru 10
Consider that continuous random variable X is uniformly distributed and takes values between a and 19 and the mean value of μ=12.
Which of the following the standard deviation for the random variable X?
Which of the following the standard deviation for the random variable X?
Seçenekler
A
4.001
B
4.041
C
4.104
D
4.101
E
4.404
Açıklama:
The variance (σ2) of the continuous uniform random variable X between a and b, X ~ U (a = 5, b = 19) can be calculated from these formula,(b−a)2 (19−5)2
σ2 =V(X)= 12 = 12 =16.33Standard deviation, σ = 4.041
σ2 =V(X)= 12 = 12 =16.33Standard deviation, σ = 4.041
Soru 11
Which of the following is not a continuous random variable?
Seçenekler
A
amount of rainfall in Eskişehir
B
number of university students in Eskişehir
C
flow rate of Porsuk river
D
length of streets of Eskişehir
E
flight height of owls over Anadolu University
Açıklama:
number of university students in Eskişehir. pg. 179. Correct answer is B.
Soru 12
Consider the probability density function f(x)=0.04, for 15 ≤ x ≤ 40 and determine the probability of P (25 <= X <= 35) ?
Seçenekler
A
0.1
B
0.2
C
0.4
D
0.5
E
0.8
Açıklama:
Int(25, 35)(f(x) dx) = 0.04 * x = 0.04 x (35 - 25) = 0.04 * 10 = 0.4. pg. 180. Correct answer is C.
Soru 13
Consider the probability density function f(x)=0.025, for 20 ≤ x ≤ 60 and find the standard deviation of this function?
Seçenekler
A
101/3
B
12.5
C
15
D
151/2
E
20 / 31/2
Açıklama:
m = E(X) = Int(-sonsuz , sonsuz)(....) = Int(20, 60)(x * f(x) dx) = Int(20, 60)(x * 0.025 * dx) = girdi(20, 60)((1/2) * x2 * 0.025) = (1/2) * 0.025 * (3600 - 400) = 0.25 * 160 = 40 ; V(X) = E(X - m)2 = Int(-sonsuz , sonsuz)(....) = Int(20, 60)((x - m)2 * f(x) dx) = Int(20, 60)((x - 40)2 * 0.025 * dx) = girdi(20, 60)((1/3) * (x - 40)3 * 0.025) = (1/3) * 0.025 * (8000 - (-8000)) = (1/3) * 0.25 * 1600 = 400/3 ; sd = (400/3)1/2 = 20 / 31/2 ; . pg. 184. Correct answer is E.
Soru 14
Which one below is NOT one of the differences between continuous and discrete random variables?
Seçenekler
A
Continuous random variables take on uncountable and infinite number of possible outcomes.
B
Probabilities in continuous random variables can be determined from the area under probability density function.
C
The range of continuous random variable X comprises all real numbers in an interval.
D
To describe such structures through continuous random variables density functions are utilized.
E
Only for continuous random variables, the mean is a measure of the midpoint or center of the probability distribution.
Açıklama:
A major difference between continuous and discrete random variables is the former takes on uncountable and infinite number of possible outcomes in a given interval. Hence the range of continuous random variable X comprises all real numbers in an interval.
In contrast to discrete random variables, probabilities in continuous random variables can be determined from the area under probability density function (pdf) which is represented by f (x).
Similar to the discrete random variable the mean is a measure of the midpoint or center of the probability distribution and the variance is a measure of the dispersion or variability for data set for continuous random variables.
Soru 15
Which statements below are correct?
I Exponential distribution is a type of a discrete random variable.
II Discrete random variables have only a countable number of distinct values.
III A discrete random variable typically comprises of a counting concept.
IV Continuous random variables represent entire infinite values in an interval.
V Continuous random variables are commonly measured instead of counted.
Seçenekler
A
I, II, III, IV
B
I, II, III, V
C
II, III, IV, V
D
I, III, IV, V
E
Only I
Açıklama:
As it can be recalled that discrete random variables have only a countable number of distinct values such as 0, 1, 2, 3... etc. In other words, a discrete random variable typically comprises of a counting concept. On the other hand, continuous random variables represent entire infinite values in an interval. For that reason, continuous random variables are commonly measured instead of counted. The speed of a plane, waiting time of customers at a bank’s call center, rainfall amount in a given day and inter arrival time between two customers which arrive to the post office are commonly cited examples for continuous random variables.
Soru 16
Which one below is NOT an example of a continuous random variable?
Seçenekler
A
The speed of a plane
B
The number of students who are present in the class
C
Rainfall amount in a given day
D
Travel duration from Ankara to Eskisehir on Sundays
E
Waiting time at the university cafeteria lane during the lunch hour
Açıklama:
A discrete random variable typically comprises of a counting concept. On the other hand, continuous random variables represent entire infinite values in an interval. For that reason, continuous random variables are commonly measured instead of counted. The speed of a plane, waiting time of customers at a bank’s call center, rainfall amount in a given day and inter arrival time between two customers which arrive to the post office are commonly cited examples for continuous random variables.
Soru 17
Which option is NOT correct about the probability density function?
Seçenekler
A
Probabilities in continuous random variables can be determined from the area under probability density function.
B
The probability density function f (x), defines the physical characteristics of the random variable.
C
Probability density function basically determines the shape of the distribution for the continuous random variable X.
D
The area under the probability density function f (x) is always greater than 1.
E
For a continuous random variable X, probability density function f (x)³0 for all x.
Açıklama:
The area under the probability density function f (x) is always equivalent to 1
Soru 18
Probability density function for continuous random variable X is defined as follows;
f (x) = 0.02, for 0 ≤ x ≤ 50.
Which one below is the probability of P (X < 20)?
f (x) = 0.02, for 0 ≤ x ≤ 50.
Which one below is the probability of P (X < 20)?
Seçenekler
A
4.4
B
4.0
C
0.4
D
0.04
E
0.04
Açıklama:
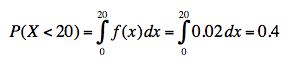
Soru 19
Consider that continuous random variable X is uniformly distributed and takes values between -5 and b and the mean value of μ = 10. Determine the value of b?
Seçenekler
A
0
B
5
C
10
D
20
E
25
Açıklama:
f(x) = 1 / (b - a) ; E(X) = (a + b) / 2 = (-5 + b) / 2 = 10 ; b = 25. pg. 186. Correct answer is E.
Soru 20
Consider that continuous random variable X is uniformly distributed and takes values between 10 and 50. Find the probability of P (15 < X < 25) ?
Seçenekler
A
0.10
B
0.15
C
0.20
D
0.25
E
0.30
Açıklama:
f(x) = 1 / (b - a) = 1 / (50 - 10) = 1 / 40 ; P (15 < X < 25) = Int(15, 25)(f(x) dx) = Int(15, 25)((1/40) dx) = girdi(15, 25)((1/40) * x) = (1/40) * (25 - 15) = 1/4 = 0.25. pg. 186. Correct answer is D.
Soru 21
z score of a standard normally distributed random variable Z for value=a is 0.1700. What is P(Z > a) ?
Seçenekler
A
0.17
B
0.25
C
0.33
D
0.67
E
0.83
Açıklama:
P(Z > a) = 0.5 - 0.17 = 0.33. pg. 193. Correct answer is C.
Soru 22
z score of a standard normally distributed random variable Z for value=-a is 0.195. What is P(Z < (-a)) ?
Seçenekler
A
0.805
B
0.695
C
0.305
D
0.265
E
0.195
Açıklama:
- P(Z < (-a)) = P(Z > a) = 0.5 - 0.195 = 0.305 . pg. 193. Correct answer is C.
Soru 23
Random variable X has normal distribution, mean μ=25 and variance σ2=16. Determine the probability P (30 ≤ X ≤ 35) in terms of standard normal distribution?
Seçenekler
A
P(0.25 ≤ z ≤ 0.75)
B
P(0.50 ≤ z ≤ 1)
C
P(0.25 ≤ z ≤ 1.5)
D
P(1 ≤ z ≤ 2)
E
P(1.25 ≤ z ≤ 2.5)
Açıklama:
z = (x - m) / sd ; sd = variance1/2 ; (30 - 25) / 4 = 1.25 ; (35 - 25) / 4 = 2.5 ; P(1.25 <= z <= 2.5). pg. 200. Correct answer is E.
Soru 24
Assume that waiting time to connect to internet at your home is normally distributed with a mean of 270 seconds and a standard deviation of 90 seconds. Find the probability that you can connect to internet in less than 210 seconds in terms of standard normal distribution?
Seçenekler
A
0.5 - P(z = 1/3)
B
0.5 - P(z = 2/3)
C
0.5 + P(z = 1/3)
D
0.5 + P(z = 2/3)
E
1 - P(z = 1/3)
Açıklama:
z = (x - m) / sd ; (210 - 270) / 90 = -2/3 ; P(z <= (-2/3)) = P(z >= 2/3) = 0.5 - P(z = 2/3) . pg. 200. Correct answer is B.
Soru 25
Suppose that random variable X has exponential distribution with λ=a. Find the probability of P (X ≥ b) ?
Seçenekler
A
e-a/b
B
e-b/a
C
-e-b/a
D
e-ab
E
-e-ab
Açıklama:
f (x) = λ e-λx = a e-ax , x ≥ 0 ; P( X >= x) = Int(b, sonsuz)(a * e−at dt) = girdi(b, sonsuz)(-e−ax) = 0 - (-e-ab) = e-ab . pg. 213. Correct answer is D.
Soru 26
Which information below is correct?
I The mean of a continuous random variable X is a weighted
average through the possible values of the random variable and associated probabilities.
II The mean of the continuous random variable is denoted by E (x).
III The mean is also called as expected value and denoted by μ.
IV The variance is denoted by V(x) or σ2.
Seçenekler
A
I, II
B
I,III
C
I, IV
D
II,III
E
II, IV
Açıklama:
For the calculation of the mean and the variance for the continuous random variables,only difference is integration substitute’s summation. The mean of the continuous random variable is denoted by μ, the mean is also called as expected value and denoted by E (x). The variance is denoted by V (x) or σ2 and it’s a measure of the scatter or variability for data set. the mean of a continuous random variable X is a weighted average through the possible values of the random variable and associated probabilities. Also, the variance of a continuous random variable X is all squared deviations are weighted with associated probability.
Soru 27
Pdf for continuous random variable X is defined as follows;
f (x) = 0.02, for 0 ≤ x ≤ 50. What is the mean of the continuous random variable X ?
f (x) = 0.02, for 0 ≤ x ≤ 50. What is the mean of the continuous random variable X ?
Seçenekler
A
25
B
0.25
C
2.5
D
30
E
3.
Açıklama:
The mean of the continuous random variable X;
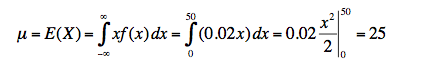
Soru 28
Pdf for continuous random variable X is defined as follows;
f (x) = 0.02, for 0 ≤ x ≤ 50. What is he variance of the continuous random variable X?
f (x) = 0.02, for 0 ≤ x ≤ 50. What is he variance of the continuous random variable X?
Seçenekler
A
833.33
B
208.33
C
104.167
D
250.5
E
0.02
Açıklama:
The variance of the continuous random variable X;
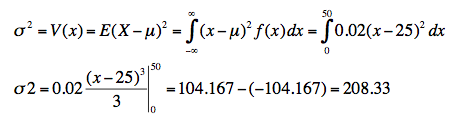
Soru 29
Pdf for continuous random variable X is defined as follows;
f (x) = 0.02, for 0 ≤ x ≤ 50. What is the standard deviation of the continuous random variable X?
f (x) = 0.02, for 0 ≤ x ≤ 50. What is the standard deviation of the continuous random variable X?
Seçenekler
A
208.33
B
833.33
C
104.167
D
14.4336
E
0. 1443
Açıklama:
The standard deviation of the continuous random variable X;
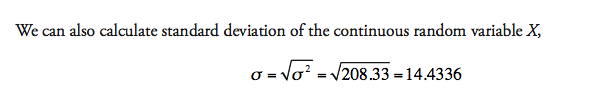
Soru 30
Which one below is an example of exponential distribution?
Seçenekler
A
The number of customers a call center representative talks
B
The ages of students in a class
C
Consumption amount in a household
D
The number of customers arrive to the bank
E
Time between two failures of a certain mechanical device
Açıklama:
Exponential distribution is another most significant and extensively used continuous probability distribution. Exponential random variable is frequently used to model the time interval between two events. Some illustrations of random variables that generally conform to model by means of exponential
distribution are presented below.
• Arrival time between two customers.
• Time between two messages.
• Time between telephone calls received by a customer service.
• Time between customers who are arriving to the checkout lane of the supermarket.
• Time between two failures of a certain mechanical device.
Soru 31
I. f (x) ≥ 0 for all x.
II. the area under probability density function between points a and b is equal to 1
III. P(a ≤ X ≤ b) is equal to 1
Which of the statements should the probability density function satisfy?
II. the area under probability density function between points a and b is equal to 1
III. P(a ≤ X ≤ b) is equal to 1
Which of the statements should the probability density function satisfy?
Seçenekler
A
Only I
B
Only II
C
I and II
D
I and III
E
II and III
Açıklama:
For a continuous random variable X, probability density function f (x) must satisfy the following
properties,
(i) f (x) ≥ 0 for all x,
(ii) the integral of f(x) between positive infinite and negative infinite is equal to 1
(iii) P(a ≤ X ≤ b) is equal to the area under probability density function between points a and b.
The answer is A.
properties,
(i) f (x) ≥ 0 for all x,
(ii) the integral of f(x) between positive infinite and negative infinite is equal to 1
(iii) P(a ≤ X ≤ b) is equal to the area under probability density function between points a and b.
The answer is A.
Soru 32
What is the area below the probability density function f (x) = 0.1, for 0 ≤ x ≤ 20 ?
Seçenekler
A
2
B
3
C
4
D
5
E
6
Açıklama:
The probability density function f (x) = 0.1 is a straight line above the values 0 to 20, therefore, it is a rectangle with one side being 0.1 value and the other 20. The area is calculated by 20*(0.1) which is equal to 2. The answer is A.
Soru 33
I. 0 ≤ F (x) ≤ 1
II. If x1 ≤ x2 then F (x1) ≤ F (x2)
III. If x1 = x2 then F (x1) = F (x2)
Which of the given statements are considered the properties of the cumulative probability function?
II. If x1 ≤ x2 then F (x1) ≤ F (x2)
III. If x1 = x2 then F (x1) = F (x2)
Which of the given statements are considered the properties of the cumulative probability function?
Seçenekler
A
Only I
B
Only II
C
I and II
D
I and III
E
II and III
Açıklama:
I. 0 ≤ F (x) ≤ 1 (True)
II. If x1 ≤ x2 then F (x1) ≤ F (x2) (True)
III. If x1 = x2 then F (x1) = F (x2) (False, If x1 ≤ x2 then F (x1) ≤ F (x2))
The answer is C.
II. If x1 ≤ x2 then F (x1) ≤ F (x2) (True)
III. If x1 = x2 then F (x1) = F (x2) (False, If x1 ≤ x2 then F (x1) ≤ F (x2))
The answer is C.
Soru 34
What is the mean of f(x) = x for 0 ≤ x ≤ 4 equal to?
Seçenekler
A
8
B
9
C
10
D
11
E
12
Açıklama:
The mean of an f(x) function is equal to the integral of that function's product to it's respective x on the given range. For the function f(x)= x for 0 ≤ x ≤ 3 the integral of x*f(x) on the range 0 to 4 is taken. This would yield to the integral of x2 which is equal to x3/3. For x=0 this would equal to 0, for x=4 this would equal to 9. The mean is equal to 9 - 0 = 9. The answer is B.
Soru 35
What is the mean of f(x) = x for 0 ≤ x ≤ 4 equal to?
Seçenekler
A
4
B
8
C
16
D
32
E
64
Açıklama:
The variance is equal to V (X) = E (X2) - [E (X)]2 for f(x) = x for 0 ≤ x ≤ 4 the f(x2)=x2 which would indicate that x*x2 is the function to take the integral in order to find the variance. The integral of x3 is x4/4 on 0 ≤ x ≤ 4 would yield to the difference of the value found from x = 4 and x = 0. For x=4 the value is 64 and for x=0 the value is 0. The difference between these values is 64. The answer is E.
Soru 36
For X which is a continuous random variable that is uniformly distributed and takes values between 3 and 9. What is the probability density function of the random variable X ?
Seçenekler
A
f(x)=0 for 3≤x≤9
f(x)=1/6 otherwise
f(x)=1/6 otherwise
B
f(x)=1/6 for 3≤x≤9
f(x)=0 otherwise
f(x)=0 otherwise
C
f(x)=1/3 for 3≤x≤9
f(x)=0 otherwise
f(x)=0 otherwise
D
f(x)=1/2 for 3≤x≤9
f(x)=0 otherwise
f(x)=0 otherwise
E
f(x)=1/6
Açıklama:
For X which is a continuous random variable that is uniformly distributed and takes values between 3 and 9, the minimum value of the random variable X is 3 (it’s the value of a) and the maximum value is 9 (it’s the value of b). Then X~U (a=3, b=9) and the probability density function of the continuous random variable X is defined as, f (x) = 1/(b − a) = 1/(9 − 3)= 1/6 for 3≤x≤9. The answer is B.
Soru 37
For X which is a continuous random variable that is uniformly distributed and takes values between 3 and 9. What is the mean of the random variable X ?
Seçenekler
A
2
B
3
C
4
D
5
E
6
Açıklama:
For X which is a continuous random variable that is uniformly distributed and takes values between 3 and 9, the minimum value of the random variable X is 3 (it’s the value of a) and the maximum value is 9 (it’s the value of b). Then X~U (a=3, b=9) and the probability density function of the continuous random variable X is defined as, f (x) = 1/(b − a) = 1/(9 − 3)= 1/6 for 3≤x≤9. The mean is equal to (9 + 3)/2 = 6. The answer is E.
Soru 38
For X which is a continuous random variable that is uniformly distributed and takes values between 3 and 9. What is the variance of the random variable X ?
Seçenekler
A
12
B
14
C
16
D
18
E
20
Açıklama:
For X which is a continuous random variable that is uniformly distributed and takes values between 3 and 9, the minimum value of the random variable X is 3 (it’s the value of a) and the maximum value is 9 (it’s the value of b). Then X~U (a=3, b=9) and the probability density function of the continuous random variable X is defined as, f (x) = 1/(b − a) = 1/(9 − 3)= 1/6 for 3≤x≤9. The variance is equal to (9 - 3)2/2 = 18. The answer is D.
Soru 39
I. The exponential random variable is frequently used to model the time interval between two events.
II. The exponential random variable is defined with a parameter λ.
III. The exponential random variable X defines the time interval between two independent events.
Which one of the given statements can be said to be true about exponential distribution?
II. The exponential random variable is defined with a parameter λ.
III. The exponential random variable X defines the time interval between two independent events.
Which one of the given statements can be said to be true about exponential distribution?
Seçenekler
A
Only I
B
Only II
C
I and II
D
I and III
E
II and III
Açıklama:
I. The exponential random variable is frequently used to model the time interval between two events. (True)
II. The exponential random variable is defined with a parameter λ. (True)
III. The exponential random variable X defines the time interval between two independent events. (False, the exponential random variable X defines the time interval between two consecutive events.)
The answer is C.
II. The exponential random variable is defined with a parameter λ. (True)
III. The exponential random variable X defines the time interval between two independent events. (False, the exponential random variable X defines the time interval between two consecutive events.)
The answer is C.
Soru 40
I. The standard normal curve is symmetric around the mean μ = 0.
II. The standard normal distribution has a standard deviation σ = 1 of the distribution.
III. The area under the standard normal distribution function for P (z ≤ 4.25) is exactly 1.
Which of the given statements can be said to be true about the standard normal distribution function?
II. The standard normal distribution has a standard deviation σ = 1 of the distribution.
III. The area under the standard normal distribution function for P (z ≤ 4.25) is exactly 1.
Which of the given statements can be said to be true about the standard normal distribution function?
Seçenekler
A
Only I
B
Only II
C
I and II
D
I and III
E
II and III
Açıklama:
The standard normal curve is symmetric around the mean μ = 0. The standard normal distribution has a standard deviation σ = 1 of the distribution. The area under the standard normal distribution function for P (z ≤ 4.25) is approximately 1.
The answer is C.
The answer is C.
Soru 41
What does a variable's taking on infinite number of possible outcomes in a given interval show?
Seçenekler
A
that it is a continuous random variable
B
that it is a discrete random variable
C
that it typically comprises of a counting concept
D
that it cannot be determined from the area under probability density function
E
that it cannot keep uncountable measures
Açıklama:
A major difference between continuous and discrete random variables is the former takes on uncountable and infinite number of possible outcomes in a given interval. Hence the range of continuous random variable X comprises all real numbers in an interval. In addition to the above given illustrations, water consumption amount in a household, weights of people in a population, the speed of wind in a open certain area, waiting time in a supermarket, checkout lanes or load on a bridge are the few examples for continuous random variable for real world applications. From these examples it’s clear that random variable X can take unaccountably infinite values. To describe such physical structures through continuous random variables density functions are utilized. Therefore, in contrast to discrete random variables, probabilities in continuous random variables can be determined from the area under probability density function (pdf) which is represented by f (x).
Soru 42
Which of the following is a measure of the midpoint or center of the probability distribution?
Seçenekler
A
Mean
B
Median
C
Mode
D
Variance
E
Range
Açıklama:
Similar to the discrete random variable the mean is a measure of the midpoint or center of the probability distribution.
Soru 43
Which of the following is a measure of the dispersion or variability for data set for continuous random variables?
Seçenekler
A
Mean
B
Mode
C
Median
D
Variance
E
Frequency
Açıklama:
The variance is a measure of the dispersion or variability for data set for continuous
random variables.
random variables.
Soru 44
For which of the following, does the probability density function f (x) of the continuous random variable X take a constant value over the range of the random variable X is defined?
Seçenekler
A
Uniform distribution
B
Normal distribution
C
Standard normal distribution
D
Exponential distribution
E
Constant distribution
Açıklama:
Continuous uniform distribution is the one of the easiest continuous random variable and the probability density function f (x) of the continuous random variable X takes a constant value over the range of the random variable X is defined.
Soru 45
The normal distribution is one of the most significant and extensively used continuous probability distribution because ...
Which of the following correctly concludes the sentence above?
Which of the following correctly concludes the sentence above?
Seçenekler
A
probability density function for normal random variable is easier to apply
B
real life applications are approximately normally distributed
C
normally distributed random variables are represented using two parameters
D
the mean of a normal random variable can have both positive and negative values including zero
E
standart deviation of the normal random variable can have both positive and negative values
Açıklama:
Normal distribution is one of the most significant and extensively used continuous probability
distribution. The major reason for this circumstance is majority of the continuous random variables
which are observed through real life applications (social, medical, physical, biological) are normally or
approximately normally distributed (bell-shaped) variables.
distribution. The major reason for this circumstance is majority of the continuous random variables
which are observed through real life applications (social, medical, physical, biological) are normally or
approximately normally distributed (bell-shaped) variables.
Soru 46
Which of the following is not true for normal distribution?
Seçenekler
A
It provides basis for the statistical inference
B
It is also called as "uniform distribution"
C
It is a symmetric distribution where random variable values are uniformly scattered around mean
D
Population mean has an effect on the shape of its function
E
Standard deviation has an effect on the shape of its function
Açıklama:
Normal distribution provides basis for the statistical inference. Normal distribution is a symmetric distribution where the random variable values are uniformly scattered around the mean. Population mean, μ and standard deviation σ parameters determine the shape of the normal distribution function. Uniform distribution is different than normal distribution.
Soru 47
- f (x) ≥ 0 for all x values
- The normal distribution function curve is symmetric around the mean, μ
- The probability density function f (x) does not the touch and intersect x axis
Seçenekler
A
Only I
B
I and II
C
I and III
D
II and III
E
I, II and III
Açıklama:
Probability density function f (x) of normal distribution has the following properties.
(i) f (x) ≥ 0 for all x values.
(ii) ∫ ∞ −∞ f (x)dx =1
(iii) The normal distribution function curve is symmetric around the mean, μ.
(iv) The probability density function f (x) does not the touch and intersect x axis.
(i) f (x) ≥ 0 for all x values.
(ii) ∫ ∞ −∞ f (x)dx =1
(iii) The normal distribution function curve is symmetric around the mean, μ.
(iv) The probability density function f (x) does not the touch and intersect x axis.
Soru 48
According to the properties that probability density function f(x) of normal distribution has, which of the following is not true?
Seçenekler
A
Probability density function of random variable x obtain the non-negative
values at all times
values at all times
B
Probability density function, f (x) decreases as the random variable value goes away from the mean, μ
C
The area under the probability density function f (x) always equivalent to 1 in the definition interval of the random variable X
D
Normal distribution curve has a similar shape on both sides of the mean x=μ
E
The left tail of the probability function touches the x axis at point 1
Açıklama:
First property assures that probability density function of random variable x obtain the non-negative values at all times. From the shape of the probability density function curve it’s obvious that pdf, f (x) decreases as the random variable value goes away from the mean, μ. Likewise, probability density function f (x) increases as the random variable value gets closer to the mean, μ. Second property identifies that the area under the probability density function f (x) always equivalent to 1 in the definition interval of the random variable X. Third property suggests that normal distribution curve has a similar shape on both sides of the mean x=μ. That property also proposes the fact that, P (X < μ ) = P (X > μ ) =0.5. Fourth property indicates that the tails of the probability function goes to infinity and at no time crosses or touches the x axis.
Soru 49
- Arithmetic mean
- Standard deviation
- Variance
Seçenekler
A
Only III
B
I and II
C
I and III
D
II and III
E
I, II and III
Açıklama:
The shape of the normal random variable is determined by the mean μ and the standard deviation σ of the distribution.
Soru 50
- Frequently used to model the time interval between two events
- It is essential to use consistent time units in the determination of probabilities
- The mean and the standard deviation of the distribution are equal
Seçenekler
A
Only I
B
I and II
C
I and III
D
II and III
E
I,II and III
Açıklama:
Exponential distribution is another most significant and extensively used continuous probability distribution. Exponential random variable is frequently used to model the time interval between two events. Exponential random variable is defined with a parameter λ and it’s represented as X~Exponential (λ). In that sense the exponential random variable X defines the time interval between two consecutive events of a Poisson process with a mean of µ = λ. Here λ parameter defines the number of events is a certain time period. Therefore, it’s essential to use consistent time units in the determination of probabilities, mean and variance with the exponential random variable X. The mean (µ) and variance (σ2) for exponential random variable X~Exponential (λ) with parameter λ can be calculated from the following formulas,
E(x) = µ = 1/λ
V (x) =σ2 = 1/λ2
Hence from above given formulas it’s clear that the mean and the standard deviation of the exponential distribution are equal.
E(x) = µ = 1/λ
V (x) =σ2 = 1/λ2
Hence from above given formulas it’s clear that the mean and the standard deviation of the exponential distribution are equal.