Econometrıcs II (ENG) - Tüm Sorular
Ünite 1
Soru 1
Which of the given functions could be a linear regression model?
Seçenekler
A
Y = β0 + β1 X1
B
Y = β0 + βx
C
Y = β0 + β1 X2
D
Y = β0 + β1 log(X1)
E
Y = β0 + β1 X(-1)
Açıklama:
Linear regression models the relationship between the dependent variable and explanatory variables where the function is linear in parameters:
Y = β0 + β1 X1+…+ βk Xk+ u where X1, X2, …, Xk are the explanatory variables, Y is the dependent variable e is the error.
The answer is A.
Y = β0 + β1 X1+…+ βk Xk+ u where X1, X2, …, Xk are the explanatory variables, Y is the dependent variable e is the error.
The answer is A.
Soru 2
I. According to the Gauss-Markov theorem, have the least variance among the class of estimators that are linear and unbiased.
II. The minimum variance of an OLS estimator indicates it is the most efficient estimator as it provides the tightest estimates around the population value of the parameter.
III. According to the Gauss-Markov theorem, have the least variance among the class of estimators that are non-linear and biased.
What can be said to be true about the OLS estimators?
Seçenekler
A
Only I
B
Only II
C
Only III
D
I and II
E
I and III
Açıklama:
The OLS estimators, according to the Gauss-Markov theorem, have the least variance among the class of estimators that are linear and unbiased. Linear term in the Gauss-Markov theorem, simply indicates that we are working within the linear regression framework. Unbiasedness is crucial for an estimator since it means that the estimator does not systematically miscalculate the estimates. Finally, the minimum variance of an OLS estimator indicates it is the most efficient estimator as it provides the tightest estimates around the population value of the parameter.
The answer is D
The answer is D
Soru 3
What is the spread, dispersion, or variability of the errors is consistent throughout the range of values of the explanatory variables?
Seçenekler
A
Homoskedasticity
B
Multicollinearity
C
Exogeneity
D
Normality
E
Heteroskedasticity
Açıklama:
Homoskedasticity means that the spread, dispersion, or variability of the errors is consistent
throughout the range of values of the explanatory variables.
The answer is A.
throughout the range of values of the explanatory variables.
The answer is A.
Soru 4
Which of the given could be among the consequences of heteroskedasticity?
Seçenekler
A
The model becomes non-linear in parameters.
B
The t and F statistics are no longer t and F distributed.
C
The bias in the standard errors are reliable for hypothesis testing and confidence intervals.
D
The LM statistic has an asymptotic chi-square distribution.
E
The OLS estimator can still be efficient under heteroskedasticity.
Açıklama:
Heteroskedasticity is fundamentally the violation of assumption A5. The assumptions of OLS do not affect each other. Hence the violation of A5 has no effect on the first four assumptions. Consequently, our model is still linear in parameters (A1 is satisfied), the sample used to estimate the coefficients for the model is selected randomly (A2 is satisfied), any variable or a group of them in the data set is not a linear combination of the others (A3 is satisfied), and explanatory variables are not related to the residuals (A4 is satisfied). In other words, heteroskedasticity causes no bias in the estimates of the OLS coefficients.
The OLS estimators are still unbiased, however, the OLS estimates of the standard errors of coefficients, se(bk) for k=0,1,…, K, are biased. The bias in the standard errors leads to unreliable hypothesis testing and confidence intervals.
The t and F statistics are no longer t and F distributed and the LM statistic no longer has an asymptotic chi-square distribution. Therefore, the test statistics we have covered in the quick review portion of the chapter are no longer valid.
The OLS estimator is no longer efficient under heteroskedasticity. When heteroskedasticity is present, the variance of the error term varies with the level of the independent variable. As a result, the OLS estimator tends to give too much weight to observations with smaller errors. Inefficient estimates refer to parameter estimates that have a higher degree of variability or uncertainty compared to the alternative estimators. An estimator is deemed inefficient if it does not make full use of the available information in the data, leading to a greater degree of uncertainty in the estimated parameter values.
The answer is B.
Soru 5
I. LM-test
II. Model Specification
III. Robust Standard Errors
Which of the given can be used to deal with a model with serially correlated residuals?
II. Model Specification
III. Robust Standard Errors
Which of the given can be used to deal with a model with serially correlated residuals?
Seçenekler
A
Only I
B
Only II
C
I and II
D
I and III
E
II and III
Açıklama:
The utilization of OLS without any alteration in inference or any other modifications when residuals
of the model is serially correlated lead to many problems. Here we are discussing how to deal with a model with serially correlated residuals:
Robust standard errors: As in the heteroskedasticity model can be estimated with OLS then any
inference can be conducted with robust standard errors.
Model Specification: Although it has a quite humble name, this item incorporates three crucial
topics: differencing, lagged values of variables, and deterministic terms.
Cochrane-Orcutt and Prais-Winsten procedures: These procedures involve transforming the
original models by quasi-differencing and estimating the model on the transformed data.
The answer is E.
Soru 6
I. Breusch Pagan-Godfrey Test
II. Durbin’s t tests
III. Modified White (MWh) Test
Which of the given tests are used to test heteroskedasticity?
II. Durbin’s t tests
III. Modified White (MWh) Test
Which of the given tests are used to test heteroskedasticity?
Seçenekler
A
Only I
B
Only II
C
I and II
D
I and III
E
II and III
Açıklama:
We will discuss two main types of tests: auxiliary regression-based tests and an order-based test. BreuschPagan-Godfrey (BPG), White, and Modified White tests are the most elementary and most popular tests of heteroskedasticity. The order-based tests are the most intuitive tests. Here we will examine the GoldfeldQuandt (GQ) test.
The answer is D.
The answer is D.
Soru 7
I. R2 is overstated giving the impression of a well-fitted model
II. The t and F tests are overstated, and prone to rejecting the null hypothesis even if it is correct
III. The OLS estimates of the standard errors of coefficients are unbiased
Which of the given could be among the consequences of serial correlation?
II. The t and F tests are overstated, and prone to rejecting the null hypothesis even if it is correct
III. The OLS estimates of the standard errors of coefficients are unbiased
Which of the given could be among the consequences of serial correlation?
Seçenekler
A
Only I
B
Only II
C
I and II
D
I and III
E
II and III
Açıklama:
The consequences of serial correlation resemble those of heteroskedasticity to a great extent. The
regression coefficients are still unbiased since the first four assumptions listed in the quick review remain untouched by serial correlation. However the OLS estimates of the standard errors of coefficients, se( ˆβ k ) for k=0,1,…, K, are biased. The usual t and F tests of significance are no longer valid. Finally, the OLS estimator is no longer efficient under serial correlation.
The only distinction is that we now know the direction of the bias in the residual statistics. With
heteroskedasticity, the direction of the bias cannot be determined. Standard errors are biased downward; therefore, the t and F tests are overstated, and prone to rejecting the null hypothesis even if it is correct. Finally, R2 is also overstated giving the impression of a well-fitted model.
The answer is C.
Soru 8
I. The explanatory variables must be controlled by the experimenter (non-stochastic) which is never the case.
II. The model that is tested must include an intercept.
III. It only tests for second-order autocorrelation in the residuals in models with lagged dependent variables.
What can be said to be true about the Durbin Watson (DW) d-test?
II. The model that is tested must include an intercept.
III. It only tests for second-order autocorrelation in the residuals in models with lagged dependent variables.
What can be said to be true about the Durbin Watson (DW) d-test?
Seçenekler
A
Only I
B
Only II
C
I and II
D
I and III
E
II and III
Açıklama:
Durbin Watson (DW) d test is quite popular despite its disadvantages. First, it only tests for first-order autocorrelation in the residuals in models without lagged dependent variables. Second, the explanatory variables must be controlled by the experimenter (non-stochastic) which is never the case. Economists rarely actually control the explanatory variables. Third, the model that is tested must include an intercept. Rarely in econometrics, we estimate models without intercepts, so this is not a great disadvantage. Finally, its critical values do not come from a distribution.
The answer is C.
The answer is C.
Soru 9
I. Generalized Least Squares
II. Model Specification
III. Non-Linear Models
Which of the given can be used to deal with a model with heteroskedasticity?
II. Model Specification
III. Non-Linear Models
Which of the given can be used to deal with a model with heteroskedasticity?
Seçenekler
A
Only I
B
Only II
C
Only III
D
I and II
E
I and III
Açıklama:
There are numerous ways to handle heteroskedasticity in a regression model:
• Robust standard errors: Adopting robust standard errors, which correct the sample estimate of
the standard errors to take heteroskedasticity into account, is a straightforward option.
• Generalized Least Squares: Generalized least squares (GLS) estimator gives the squared residuals
various weights depending on how much variance they are anticipated to have.
• Transformations: The dependent variable or the independent variables can be transformed to
address heteroskedasticity.
• Non-linear models: Finally, if the heteroskedasticity is too severe, it may be necessary to use
non-linear regression models or other alternative methods that are robust to heteroskedasticity,
such as generalized linear models (GLMs) or quantile regression.
The answer is E.
Soru 10
For a regression TSS (total sum of squares)= 100, ESS (explained sum of squares)=50, and RSS (residual sum of squares) =50; what is the R2 (R-squared) statistics?
Seçenekler
A
2
B
0,50
C
0,40
D
0,20
E
0,15
Açıklama:
we can obtain R2 (R-squared) statistics,
R2= ESS/TSS = 1− (RSS/TSS) ,
R2=50/100 or 1-(50/100)=1/2=0,50
The answer is B.
R2= ESS/TSS = 1− (RSS/TSS) ,
R2=50/100 or 1-(50/100)=1/2=0,50
The answer is B.
Soru 11
What is the meaning of Ordinary Least Squares (OLS)?
Seçenekler
A
Maximization of robust residuals.
B
Minimizing the sum of squared residuals.
C
Average of the linear regression.
D
Sum of the maximum residuals
E
Minimum ratio of the coefficients.
Açıklama:
As the name suggests, OLS is base on the least squares principles. Is it equivalent to searching for estimates of the parameters that minimize the sum of squared residuals.
Soru 12
What is the two important specialities of OLS estimators?
Seçenekler
A
Nonlinear and unbiased
B
Nonlinear and biased
C
Linear and unbiased
D
Unbiased and parabolic
E
Linear and biased
Açıklama:
The OLS estimators, according to the Gauss-Markov theorem, have the least variance among the class of estimators that are linear and unbiased.
Soru 13
What is not one of the essential specialities of assumptions in OLS?
Seçenekler
A
Heteroskedasticity
B
No serial correlation
C
No perfect multicollinearity
D
Strict exogeneity
E
Perfectly specified model
Açıklama:
One of the assumptions in OLS is homoskedasticity which describes the equality of variances in the errors of a regression model.
Soru 14
Which tool is used for the measure that how much of the variance in the dependent variable is explained by the explanatory variables?
Seçenekler
A
t-test
B
F- test
C
LM-test
D
Probability value
E
R2 statistics
Açıklama:
R2 statistics measures how much of the variance in the dependent variable is explained by the explanatory variables.
Soru 15
Which undesired process occurs when the spread of the errors in the across all values of the independent variable?
Seçenekler
A
Heteroskedasticity
B
Autocorrelation
C
Covariance
D
Endogeneity
E
Robust standard errors
Açıklama:
Homoskedasticity occurs when the spread of the errors is the same across all values of the independent variable.
Soru 16
Which test checks both heteroskedasticity and functional form specification errors?
Seçenekler
A
Breusch- Pagan- Godfrey (BPG) Test
B
Modified White Test
C
Goldfeld- Quandt Test
D
White Test
E
Durbin- Watson Test
Açıklama:
White test not only checks for heteroskedasticity but for function form specification errors as well.
Soru 17
Which test is not appropriate for serial correlation when lagged values of the dependent variable occur in the model?
Seçenekler
A
Durbin Watson h Test
B
Durbin Watson d Test
C
Durbin Watson t Test
D
Breusch- Godfrey Test
E
Durbin Watson z Test
Açıklama:
DW d test is not appropriate when lagged values of the dependent variable occur in the model.
Soru 18
Which test statistics focuses on the statistical significance of coefficient?
Seçenekler
A
Probability value
B
t-test
C
F-test
D
LM-test
E
R2 statistics
Açıklama:
We are focusing on a hypothesis known as the statistical significance of a coefficient in t-test. Statistical significance for a coefficient estimate is desirable to a certain extent.
Soru 19
In which challenge’s existence, are the Cochrane- Orcutt and Prais- Winsten procedures applied to handle with?
Seçenekler
A
Serial correlation
B
Heteroskedasticity
C
Nonlinearity
D
Biased residuals
E
Robust standard errors
Açıklama:
Cochrane- Orcutt and Prais- Winsten procedures are used to address serial correlation challenge.
Soru 20
Which challenge means that residuals are related to each other?
Seçenekler
A
Serial correlation
B
Heteroskedasticity
C
Nonlinearity
D
Homoskedasticity
E
Ordinary Least Squares
Açıklama:
Serial correlation means that residuals are related to each other.
Ünite 2
Soru 1
What is a endogenous regressors?
Seçenekler
A
It implies that certain variables within the model are determined within the system itself.
B
It implies that certain variables within the model are determined outside the system itself.
C
It implies that certain variables within the model are not necessarily determined.
D
It implies that certain variables within the model are constant in the system itself.
E
It implies that certain variables outside the model are determined within the system itself.
Açıklama:
The term “endogenous regressors” implies that certain variables within the model are determined within the system itself. Although our model may consist of only one equation, some variables can be influenced and shaped by hidden or ignored equations operating within the system. This interdependence can lead to the endogeneity problem, impacting the reliability of our results.
The answer is A.
The answer is A.
Soru 2
I. A simultaneous equation, also known as a system of equations, is a set of two or more equations with multiple variables that are connected and must be solved together.
II. The solution to a simultaneous equation is a set of values for the variables that satisfy all the given equations simultaneously.
III. In economics, simultaneous equations are rarely used to model various economic relationships and phenomena.
Which of the given statements can be said to be true about simultaneous equations?
Seçenekler
A
Only I
B
Only II
C
I and II
D
I and III
E
II and III
Açıklama:
A simultaneous equation, also known as a system of equations, is a set of two or more
equations with multiple variables that are connected and must be solved together. The solution to a
simultaneous equation is a set of values for the variables that satisfy all the given equations simultaneously. In economics, simultaneous equations are frequently used to model various economic relationships and phenomena.
The answer is C.
Soru 3
I. It is a common issue in statistical and econometric analysis that arises when the explanatory variable(s) used in a regression model are correlated with the error term or disturbance in the model.
II. The correlation between the explanatory variable(s) used in a regression model and the error term or disturbance violates the assumption of exogeneity, which is a key assumption for obtaining unbiased and consistent parameter estimates in regression analysis.
III. In simple terms, endogeneity bias occurs when there is a one-way causal relationship between the independent variable and one or more regressors, making it difficult to determine the true cause-and-effect relationship.
What can be said to be true about the endogeneity bias?
Seçenekler
A
Only I
B
Only II
C
I and II
D
I and III
E
II and III
Açıklama:
Endogeneity bias, also known as endogeneity problem, is a common issue in statistical and econometric analysis that arises when the explanatory variable(s) used in a regression model are correlated with the error term or disturbance in the model. This correlation violates the assumption of exogeneity, which is a key assumption for obtaining unbiased and consistent parameter estimates in regression analysis. In simple terms, endogeneity bias occurs when there is a two-way causal relationship between the dependent variable and one or more regressors, making it difficult to determine the true cause and effect relationship, which is shadowed behind so-called endogeneity bias.
The answer is C.
The answer is C.
Soru 4
I. The 2SLS method addresses the endogeneity problem by using instrumental variables (IVs) to proxy for the endogenous variables and identify the causal effect more accurately.
II. The 2SLS method is unusable when dealing with simultaneous equations models where there is endogeneity and simultaneous causation between variables.
III. The two-stage least squares method is an essential tool in econometrics for addressing endogeneity and obtaining reliable estimates of causal relationships.
What can be said to be true about the Two-Stage Least Squares method (2SLS)?
Seçenekler
A
Only I
B
Only II
C
I and II
D
I and III
E
II and III
Açıklama:
The 2SLS method provides a way to obtain consistent and unbiased estimates when dealing with
endogeneity problems. First, the 2SLS method addresses the endogeneity problem by using instrumental variables (IVs) to proxy for the endogenous variables and identify the causal effect more accurately. By finding valid instrumental variables, the 2SLS method allows researchers to isolate the exogenous variation in the endogenous variables and obtain consistent estimates of the causal relationship. Moreover, the 2SLS method is particularly useful when dealing with simultaneous equations models where there is endogeneity and simultaneous causation between variables. It allows researchers to break the simultaneity problem and obtain consistent estimates of the underlying relationships. Consequently, the two-stage least squares method is an essential tool in econometrics for addressing endogeneity and obtaining reliable estimates of causal relationships. By using instrumental variables and a two-stage procedure, the 2SLS method provides a robust and effective solution to the challenges posed by endogeneity in regression analysis, making it a valuable tool for empirical research in economics and related fields.
The answer is D.
Soru 5
Which of the given statements about the reasons to test for endogeneity can be said to be false?
Seçenekler
A
By testing for endogeneity and using appropriate techniques to address it, researchers can obtain more reliable and valid inference from their models.
B
Endogeneity can create spurious connections, making it easier to determine the true direction of causality.
C
Endogeneity can lead to biased and inconsistent parameter estimates in regression analysis.
D
By testing for endogeneity, researchers can identify potential problems with causality and employ appropriate methods to establish causal relationships more accurately.
E
If endogeneity is not addressed, the results obtained from the analysis may not reflect the true relationships between variables.
Açıklama:
Testing for endogeneity is essential in econometric and statistical analysis for several reasons. In
many economic and social science studies, the main goal is to establish a causal relationship between the explanatory and dependent variables. However, endogeneity can create spurious connections, making it difficult to determine the true direction of causality. By testing for endogeneity, researchers can identify potential problems with causality and employ appropriate methods to establish causal relationships more accurately. Moreover, Endogeneity can lead to biased and inconsistent parameter estimates in regression analysis as we discussed earlier. If endogeneity is not addressed, the results obtained from the analysis may not reflect the true relationships between variables. By testing for endogeneity and using appropriate techniques to address it, researchers can obtain more reliable and valid inference from their models.
The answer is B.
Soru 6
I. Endogeneity problem in regression models occurs when the Gauss-Markov assumption on zero
the conditional expectation is violated.
II. The endogeneity problem (bias) results from the independence between the model’s error term and regressor(s).
III. The error term is independent of the regressor if this assumption fails, we cannot control other variables since the error term and regressor move together.
What can be said to be true about the Endogeneity problem?
Seçenekler
A
Only I
B
Only II
C
I and II
D
I and III
E
II and III
Açıklama:
Endogeneity problem in regression models occurs when the Gauss-Markov assumption on zero
the conditional expectation is violated. Consider a simple linear regression model Y=β0+β1X+u. The zero conditional expectation assumption can be written as E[u|X ] = cov(u, X) = 0. In this case, we can say that the error term is independent of the regressor; in other words, the error term does not carry any common information with the regressor. This assumption is critical because it is required to ensure the ceteris paribus assumption when we interpret the coefficient β1. If this assumption fails, we cannot control other variables since the error term and regressor move together. Moreover, the presence of such a situation engenders bias, sometimes called endogeneity bias. Consequently, the endogeneity problem (bias) results from dependence between the model’s error term and regressor(s). Notice that we can generalize this problem to the multiple linear regression model with the same principles.
The answer is D.
Soru 7
What is the situation where one or more variables used in a statistical analysis are measured imprecisely or with error?
Seçenekler
A
Errors in Variables
B
Simultaneous Equation
C
Sample Selection Problem
D
Endogeneity Bias
E
Endogeneity Problem
Açıklama:
In economics and finance, “errors in variables,” also known as measurement error, refers to the situation where one or more variables used in a statistical analysis are measured imprecisely or with error.
The answer is A.
The answer is A.
Soru 8
I. The main idea in testing overidentification restriction is to check whether any instrument is endogenous.
II. “Exogeneity” of the instruments dictates that the instruments should be related to the error term of the original regression
III. The test done to testing overidentification restriction can tell us which instrument(s) is(are) problematic.
Which of the given statements about "testing overidentification restrictions" can be said to be true?
Seçenekler
A
Only I
B
Only II
C
Only III
D
I and II
E
I and III
Açıklama:
One particularly important question about the endogeneity testing 2SLS estimation is about the validity of the instruments, which has two dimensions coming from the assumptions on instruments. The first dimension called “relevance” requires that the instruments are related to the endogenous variables. We have already discussed this issue under the “weak instruments problem”. The second issue called “exogeneity” of the instruments dictates that the instruments should not be related to the error term of the original regression. This issue is investigated under the name “overidentification restriction”. The main idea in testing overidentification restriction is to check whether any instrument is endogenous.
The test done to testing overidentification restriction does not tell us which instrument(s) is(are) problematic.
The answer is E.
The test done to testing overidentification restriction does not tell us which instrument(s) is(are) problematic.
The answer is E.
Soru 9
I. Supply and Demand Equations
II. Economic Profit Equation
III. IS-LM Model
IV. Investment and Savings Equations
Which of the given equations in economics can be listed as simultaneous equations?
II. Economic Profit Equation
III. IS-LM Model
IV. Investment and Savings Equations
Which of the given equations in economics can be listed as simultaneous equations?
Seçenekler
A
Only I
B
I and II
C
I, II and III
D
I, II and IV
E
I, III and IV
Açıklama:
In economics, simultaneous equations are frequently used to model various economic relationships and phenomena. Some examples of simultaneous equations in economics can be listed as follows:
1) Supply and Demand Equations
2) Investment and Savings Equations
3) IS-LM Model
The answer is E.
1) Supply and Demand Equations
2) Investment and Savings Equations
3) IS-LM Model
The answer is E.
Soru 10
Which two conditions should a proper instrument should satisfy?
Seçenekler
A
Homogeneity and Exogeneity
B
Exogeneity and Relevance
C
Endogeneity and Relevance
D
Exogeneity and Biased
E
Linear and Unbiased
Açıklama:
The 2SLS method provides a way to obtain consistent and unbiased estimates when dealing with endogeneity problems. First, the 2SLS method addresses the endogeneity problem by using instrumental variables (IVs) to proxy for the endogenous variables and identify the causal effect more accurately. By finding valid instrumental variables, the 2SLS method allows researchers to isolate the exogenous variation in the endogenous variables and obtain consistent estimates of the causal relationship.
Accordingly, a proper instrument should satisfy two conditions: exogeneity and relevance.
The answer is B.
Accordingly, a proper instrument should satisfy two conditions: exogeneity and relevance.
The answer is B.
Ünite 3
Soru 1
Which of the following best describes seasonal variation in a time series?
Seçenekler
A
Long-term tendency of upward or downward movement over time.
B
Oscillations around the long-term trend curve.
C
Permanent fluctuations within a specific time period.
D
Predictable fluctuations occurring regularly within a year.
E
Short-term unpredictable changes due to random events.
Açıklama:
Seasonal Change: Permanent fluctuations in a specific time period within a year, such as monthly or quarterly, can indicate seasonal changes in time series.
Soru 2
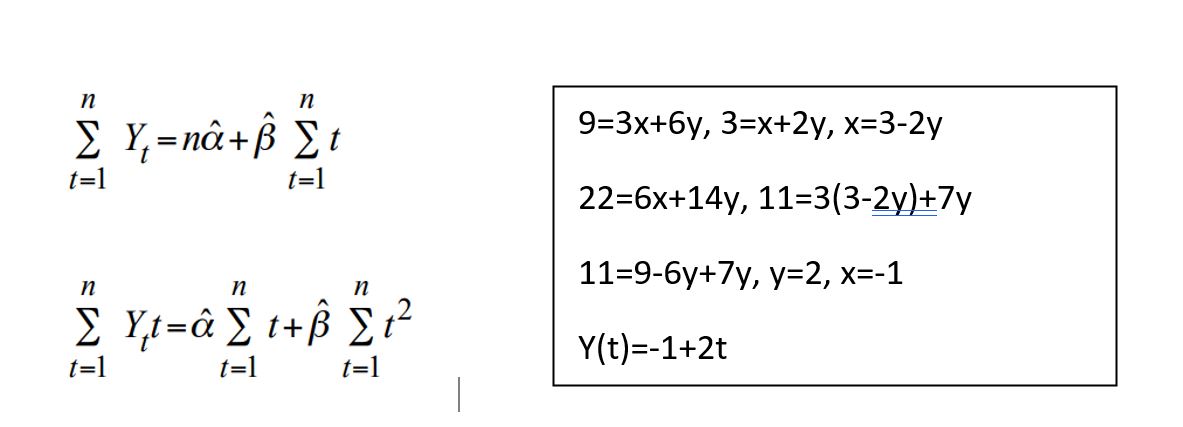
| Years | Y(t) | t | Y(t)t | t2 |
| 2015 | 1 | 1 | 1 | 1 |
| 2016 | 3 | 2 | 6 | 4 |
| 2017 | 5 | 3 | 15 | 9 |
Seçenekler
A
0.5
B
-1
C
3
D
2
E
-2
Açıklama:
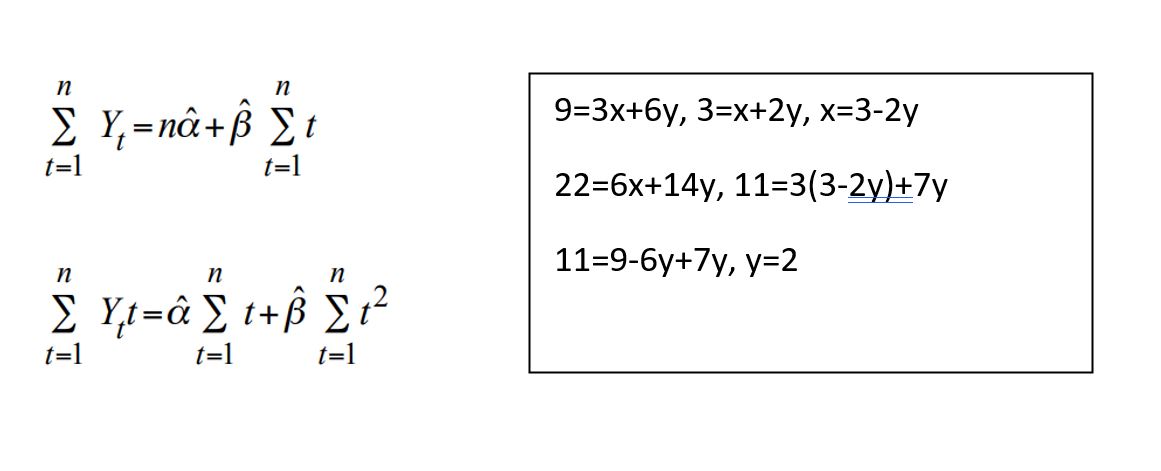
Soru 3
| Years | Y(t) | t | Y(t)t | t2 |
| 2015 | 1 | 1 | 1 | 1 |
| 2016 | 3 | 2 | 6 | 4 |
| 2017 | 5 | 3 | 15 | 9 |
Seçenekler
A
Y(t)=0.5-2t
B
Y(t)=2+8t
C
Y(t)=2-t
D
Y(t)=-2t
E
Y(t)=-1+2t
Açıklama:
Soru 4
Which component of a time series reflects the observed but unpredictable changes after decomposing the effects of trend, cyclical movements, and seasonal variation?
Seçenekler
A
Trend
B
Random variation
C
Cyclical movements
D
Seasonal variation
E
Predictable fluctuations
Açıklama:
Random Variation: It is the component that reflects the upward and downward oscillations in a time series after decomposing the effects of trend, cyclical movements and seasonal variation. The random component refers to the observed but unpredictable changes in time series as a result of random events that occur because of unforeseen (unexpected) movements such as political events, natural disasters, war or famines.
Soru 5
How does a moving average address short-term fluctuations in a time series?
Seçenekler
A
By taking successive averages of groups of observations.
B
By modeling seasonal variation.
C
By detrending the time series.
D
By identifying outliers.
E
By fitting a polynomial curve.
Açıklama:
A moving average removes the short-term fluctuations in a time series by taking successive averages of groups of observations.
Soru 6
What is a key advantage of exponential smoothing methods over moving averages?
Seçenekler
A
Exponential smoothing methods are easier to implement.
B
Exponential smoothing methods provide forecasts with higher accuracy.
C
Exponential smoothing methods remove seasonal variation completely.
D
Exponential smoothing methods can handle non-linear trends.
E
Exponential smoothing methods do not require historical data.
Açıklama:
Moving averages are used in the calculation of seasonal indices as well as in producing a time series that does not contain seasonal variation and has very little random variation (irregular movement) because the moving average series are much smoother and allow the trend or cyclicality of the series to be seen quite clearly.
Soru 7
When calculating index numbers, what is the significance of choosing the base period?
Seçenekler
A
It determines the percentage increase.
B
It affects the interpretation of index values.
C
It determines the number of commodities used.
D
It ensures economic stability.
E
It determines the measurement unit.
Açıklama:
There are two major definitions of index numbers. Wheldon defines it as follows Index number is a statistical device for indicating the relative movement (dynamics) of data where measurement of actual movement is difficult or incapable of being made”; and according to Edgeworth “Index number shows by its variations (being dynamical) the changes in a magnitude which is not susceptible either of accurate measurement in itself or direct valuation in practice.
Soru 8
Price for the base period is 5 and price for the current period is 2. So what is the fixed price indes for the current period?
Seçenekler
A
20
B
30
C
40
D
50
E
60
Açıklama:
I(t)=(2/5)*100=40.
Soru 9
Price for period 2020 is 2, price for period 2021 is 5 and price for period 2022 is 6. What is the chain base price index for period 2022?
Seçenekler
A
100
B
110
C
115
D
120
E
125
Açıklama:
I(t)=(6/5)*100=120
Soru 10
What distinguishes a weighted price index from an unweighted price index?
Seçenekler
A
The choice of base period.
B
The number of items in the basket.
C
The consumption quantities used as weights.
D
The interpretation of index values.
E
The calculation method.
Açıklama:
In the weighted price index, weights are consumption quantities.
Ünite 4
Soru 1
Which of the following is a key concept in time series analysis that implies statistical properties remain constant over time?
Seçenekler
A
Stationary process
B
Autocorrelation function (ACF)
C
Partial autocorrelation function (PACF)
D
White noise processes
E
Trend analysis
Açıklama:
Stationary process implies statistical properties remain constant over time.
Soru 2
Which univariate time series model captures dependencies within a series based on its own past values?
Seçenekler
A
Moving Average (MA)
B
Autoregressive Integrated Moving Average (ARIMA)
C
Autoregressive Moving Average (ARMA)
D
Autoregressive (AR)
E
Exponential Smoothing
Açıklama:
AR models capture dependencies within a series based on its own past values.
Soru 3
There is such a time series that autocovariancesare y(0)=1.45,and y(k)=0 for k>1. Which of the following time series models is the appropriate model for the data?
Seçenekler
A
MA(1)
B
AR(1)
C
AR(2)
D
MA(2)
E
AR(3)
Açıklama:
This process is always stationary. In contrast, for the MA(1) model to be invertible, the root of the equation (1 - θ1L)=0 must be greater than 1 as an absolute value.
Soru 4
In an ARIMA(p, d, q) model, what does the 'd' represent?
Seçenekler
A
The number of autoregressive terms
B
The number of moving average terms
C
The order of the autoregressive component
D
The order of the moving average component
E
The number of times the series needs to be differenced to achieve stationarity
Açıklama:
ARIMA(p, d, q), that is, it is an autoregressive integrated moving average time series, where p denotes the number of autoregressive terms, d the number of times the series has to be differenced before it becomes stationary, and q the number of moving average terms.
Soru 5
How are ARMA(p,q) models typically identified in time series analysis?
Seçenekler
A
By conducting hypothesis testing on the time series data
B
By comparing the mean and variance of the time series data
C
By calculating the sample autocorrelation and partial autocorrelation functions
D
By estimating the theoretical autocorrelation and partial autocorrelation functions
E
By fitting a linear regression model to the time series data
Açıklama:
In determining the appropriate ARMA(p,q) model, the theoretical autocorrelation of stationary ARMA processes and the general tendency of partial autocorrelation functions are utilized.
Soru 6
The autocorrelations for first, second and third lags were calculated as 0.5, 0.3 and 0.2 for a time series of n=100 observations, respectively. Assuming that the adequate model for this time series data is the AR(2) model, which of the following the parameters with the method of moments?
Seçenekler
A
0,47 and 0,07
B
1,4 and 0,6
C
0,27 and 0,08
D
1,47 and 0,7
E
0,5 and -0,64
Açıklama:
The method of moments estimator of the parameters is obtained as follows
1. (0,5*(1-0,3))/(1-(0,5*0,5))=0,47
2. (0,3-(0,5*0,5))/(1-(0,5*0,5)) =0,07.
1. (0,5*(1-0,3))/(1-(0,5*0,5))=0,47
2. (0,3-(0,5*0,5))/(1-(0,5*0,5)) =0,07.
Soru 7
Which parameter estimation technique is typically used for moving average (MA) models due to their nonlinearity?
Seçenekler
A
Method of moments
B
Linear least squares (LS)
C
Nonlinear least squares
D
Maximum likelihood estimation (MLE)
E
Bayesian estimation
Açıklama:
Due to the nonlinearity of moving average models in terms of their parameters, the linear LS method cannot be used to apply to these models. MA models require the use
of nonlinear estimation methods. It is possible to get estimations of the parameters that will result in the likelihood function maximum if partial derivatives of the logarithmic likelihood function by parameters are taken and equalized to zero.
of nonlinear estimation methods. It is possible to get estimations of the parameters that will result in the likelihood function maximum if partial derivatives of the logarithmic likelihood function by parameters are taken and equalized to zero.
Soru 8
Using time series data consisting of 100 observations, the autocorrelations for the first and second lags are estimated as 0.3 and 0.2. Which of the following is the estimation value of the partial autocorrelation coefficient for the lag one?
Seçenekler
A
0.2
B
0.5
C
0.3
D
0.7
E
0.9
Açıklama:
If k=1 is taken in this system of equations, ρ1 is found as follows
ρ1=ϕ11 ρ0
ϕ11=ρ1 so ρ1=0.3.
ρ1=ϕ11 ρ0
ϕ11=ρ1 so ρ1=0.3.
Soru 9
Using time series data consisting of 100 observations, the autocorrelations for the first and second lags are estimated as 0.5 and 0.325. Which of the following is the estimation value of the partial autocorrelation coefficient for the lag two?
Seçenekler
A
0.1
B
0.3
C
0.5
D
0.4
E
0.6
Açıklama:
If k=1 is taken in this system of equations, ρ1 is found as follows
ρ1=ϕ11 ρ0
ϕ11=ρ1
If k=2 and ρ0=0 are taken, the following equations are obtained
ρ1=ϕ21+ϕ22 ρ1
ρ2=ϕ21 ρ1+ϕ22=0.1
ρ1=ϕ11 ρ0
ϕ11=ρ1
If k=2 and ρ0=0 are taken, the following equations are obtained
ρ1=ϕ21+ϕ22 ρ1
ρ2=ϕ21 ρ1+ϕ22=0.1
Soru 10
What is the main purpose of the partial autocorrelation function (PACF) in time series analysis?
Seçenekler
A
To detect outliers and anomalies.
B
To estimate the parameters of ARMA models.
C
To measure the strength of the relationship between two different time series.
D
To identify the direct relationship between observations at different lags after controlling for intermediate lags.
E
To identify trends in the time series data.
Açıklama:
In practice, since the theoretical autocorrelation and partial autocorrelation functions are unknown, the theoretical autocorrelation and partial autocorrelation functions are estimated by calculating the sample autocorrelation and partial autocorrelation functionsfrom the observed time series. Theoretical autocorrelation and partial autocorrelations can be tested whether they are equal to zero. Thus, the theoretical autocorrelation and partial autocorrelation functions of ARMA models are matched with the pattern of the sample autocorrelation and partial autocorrelation functions to identify the tentative appropriate model.
Ünite 5
Soru 1
What does the statement "single equation models could not be enough to explain the relationships among the economic variables because of the bi-directional causality" imply about the analysis of economic relationships?
Seçenekler
A
Single equation models are always the preferred method for analyzing economic relationships due to their simplicity.
B
The use of system equations is unnecessary when analyzing economic variables, as single equation models can handle all types of causality.
C
Bi-directional causality among economic variables necessitates the use of system equations rather than single equation models for a more accurate analysis.
D
Economic variables do not exhibit bi-directional causality, making single equation models sufficient for all econometric analyses.
E
The direction of causality in economic relationships is not important, so single equation models are always adequate.
Açıklama:
If your answer is incorrect, then go over the “Introduction” section.
In the single equation models, the direction of the causality is from the independent variable(s) to the dependent variable. On the other hand, we imply that the single equation models could not be enough to explain the relationships among the economic variables because of the bi-directional causality. Therefore, the practitioners would prefer to apply the system of equations.
In the single equation models, the direction of the causality is from the independent variable(s) to the dependent variable. On the other hand, we imply that the single equation models could not be enough to explain the relationships among the economic variables because of the bi-directional causality. Therefore, the practitioners would prefer to apply the system of equations.
Soru 2
Which of the following statements best reflects the relationship between simultaneity and endogeneity within the framework of classical linear regression models?
Seçenekler
A
Simultaneity is a phenomenon where variables occur at the same time but has no impact on the concept of endogeneity in regression analysis.
B
Simultaneity is a form of endogeneity that arises when an explanatory variable is correlated with the error term, violating the assumption of exogeneity in classical linear regression models.
C
Endogeneity only occurs due to omitted variable bias and measurement errors, and simultaneity is a separate issue that does not affect regression models.
D
In classical linear regression models, explanatory variables are assumed to be endogenous, which means simultaneity is a condition that is always met.
E
Simultaneity and endogeneity are completely unrelated concepts; simultaneity is a technique used to ensure variables are exogenous.
Açıklama:
If your answer is incorrect, then go over the “Simultaneity and Simultaneous Equations” section.
Statements regarding simultaneity and endogeneity:
Statements regarding simultaneity and endogeneity:
- "We observe that some of the variables affect each other simultaneously in the system equations, so the main feature of the system equations is simultaneity."
- "In simultaneous equations, it is not clear which variable is dependent or independent so we identify the variables as exogenous and endogenous. The endogenous variables are defined as the variables that mutually affect each other within the model."
Soru 3
Why is endogeneity considered problematic in econometric analysis?
Seçenekler
A
It ensures that the parameter estimates are always accurate and reliable.
B
It leads to biased and inconsistent parameter estimates, rendering the econometric analysis results unreliable.
C
It simplifies the model by assuming all variables are exogenous, enhancing the reliability of the analysis.
D
It simplifies the model by assuming all variables are exogenous, enhancing the reliability of the analysis.
E
It has no significant impact on the results of econometric analysis and is generally disregarded by researchers.
Açıklama:
If your answer is incorrect, please review the “Simultaneity And Simultaneous Equations”.
section.
The underlying issues related to endogeneity can be inferred from several sections:
section.
The underlying issues related to endogeneity can be inferred from several sections:
- In the discussion on simultaneity and simultaneous equations, it is mentioned that "In simultaneous equations, it is not clear which variable is dependent or independent so we identify the variables as exogenous and endogenous. The endogenous variables are defined as the variables that mutually affect each other within the model." This highlights the challenge of determining causality and the potential for endogeneity when variables within a model influence each other.
- The introduction of Vector Autoregression (VAR) Models by Sims (1980) is noted as an alternative to simultaneous equations due to the exogeneity assumptions of some variables in simultaneous equations. The VAR approach, where all variables are treated as endogenous, is presented as a solution to overcome the limitations of traditional models that do not account for the dynamic interrelationships among variables, indirectly pointing to the problems caused by endogeneity.
Soru 4
What best describes the concept of simultaneity in econometric analysis?
Seçenekler
A
Simultaneity occurs exclusively when independent variables influence each other without affecting the dependent variable.
B
Simultaneity is observed only in linear regression models where the dependent variable does not influence the independent variables.
C
Simultaneity occurs when the dependent variable and one or more of the independent variables causally influence each other, often leading to biased estimates if not properly addressed.
D
Simultaneity is a phenomenon where the dependent variable is influenced by an external factor that is not included in the model.
E
Simultaneity refers to the situation where the independent variables are correlated with the error term, thus violating the assumptions of classical linear regression models.
Açıklama:
If your answer is incorrect, please review the “Simultaneity And Simultaneous Equations” section.
The statements that point to the correct answer regarding simultaneity, particularly in the context of econometric analysis, are as follows:
The statements that point to the correct answer regarding simultaneity, particularly in the context of econometric analysis, are as follows:
- Introduction to Simultaneity and Simultaneous Equations: The document begins with an introduction to the concept of simultaneity in econometric models, explaining that simultaneity occurs when variables within a model affect each other simultaneously. This is a foundational concept that sets the stage for understanding the complexities of simultaneous equations and the need for specialized analytical techniques.
- Discussion on Single Equation Models: It contrasts single equation models, where the direction of causality is from the independent variables to the dependent variable, with systems of equations where bi-directional causality exists. This highlights the limitations of single equation models in capturing the simultaneity present in many economic relationships.
- Explanation of Simultaneous Equations: The document elaborates on simultaneous equations, illustrating how they are used to model situations where simultaneity is present. It mentions that in these systems, some variables affect each other simultaneously, making it challenging to distinguish between exogenous and endogenous variables without resorting to the reduced forms of these equations for estimation.
- Vector Autoregression (VAR) Models: The section on VAR models further emphasizes the concept of simultaneity by presenting VAR as a tool to analyze time series data where all variables are treated as endogenously interrelated. This approach is particularly useful in capturing the dynamic interactions among variables, which are often simultaneous in nature.
- Example of VAR Model Estimation Results: The document includes an example of VAR model estimation results, which implicitly relies on the concept of simultaneity by treating all variables in the system as potentially influencing each other. This example serves to illustrate the practical application of econometric techniques designed to address simultaneity.
Soru 5
Which of the following best exemplifies the concept of simultaneity in time series analysis as discussed in the context of time series models?
Seçenekler
A
The relationship between a country's GDP growth rate and its population growth rate, where neither variable directly influences the other.
B
The scenario where an increase in consumer confidence leads to higher spending, which in turn boosts economic growth, without any feedback effect from economic growth to consumer confidence.
C
The relationship between inflation and unemployment, where an increase in inflation might decrease unemployment due to higher demand for goods (short-term Phillips curve effect), and changes in unemployment can influence inflation through wage pressures.
D
The effect of weather conditions on crop yields, where only the weather conditions directly influence the crop yields without any feedback mechanism.
E
The situation where changes in a company's operational efficiency directly lead to variations in its stock price, with no influence of the stock price on the company's operational decisions.
Açıklama:
If your answer is incorrect, please review the “Simultaneity And Simultaneous Equations” section.
The question is designed to reflect the concept of simultaneity in time series analysis, where two variables can have a bidirectional causal relationship, as illustrated by the relationship between inflation and unemployment, and stock prices and trading volume.
The question is designed to reflect the concept of simultaneity in time series analysis, where two variables can have a bidirectional causal relationship, as illustrated by the relationship between inflation and unemployment, and stock prices and trading volume.
Soru 6
Who proposed the Vector Autoregression (VAR) model as an alternative to the simultaneous equations model?
Seçenekler
A
Granger (1969)
B
Lütkepohl (2006)
C
Sims (1980)
D
Jarque and Bera (1987)
E
Hannan and Quinn (1979)
Açıklama:
If your answer is incorrect, please review the “Vector Autoregression Models” section.
Sims (1980) pointed out the exogeneity assumptions for some of the variables in the simultaneous equations and proposed the Vector Autoregression (VAR) model as an alternative model to the simultaneous equations.
Sims (1980) pointed out the exogeneity assumptions for some of the variables in the simultaneous equations and proposed the Vector Autoregression (VAR) model as an alternative model to the simultaneous equations.
Soru 7
What significant contribution did Sims (1980) make to the field of econometrics regarding the analysis of time series data?
Seçenekler
A
Sims introduced the concept of Granger causality to test for causal relationships between time series variables.
B
Sims developed the Impulse-Response Function to analyze how shocks to one variable affect others over time.
C
Sims criticized the exogeneity assumptions in simultaneous equations and proposed the Vector Autoregression (VAR) model as an alternative.
D
Sims established the method for Variance Decomposition Analysis to understand the variance in one variable explained by shocks to another variable.
E
Sims formulated the first comprehensive theory of non-stationary time series analysis, introducing unit roots and cointegration.
Açıklama:
If your answer is incorrect, please review the “Vector Autoregression Models” section.
Sims (1980) pointed out the exogeneity assumptions for some of the variables in the simultaneous equations and proposed the Vector Autoregression (VAR) model as an alternative model to the simultaneous equations.
Sims (1980) pointed out the exogeneity assumptions for some of the variables in the simultaneous equations and proposed the Vector Autoregression (VAR) model as an alternative model to the simultaneous equations.
Soru 8
What was a key criticism of simultaneous equations models as highlighted by Sims (1980), leading to the proposal of the Vector Autoregression (VAR) model as an alternative?
Seçenekler
A
The inability of simultaneous equations models to handle large datasets effectively.
B
The reliance on strict linear relationships between variables in simultaneous equations models.
C
The exogeneity assumptions for some of the variables in simultaneous equations models.
D
The lack of statistical software to estimate simultaneous equations models accurately.
E
The requirement for variables in simultaneous equations models to be stationary.
Açıklama:
If your answer is incorrect, please review the “Vector Autoregression Models” section.
Sims (1980) pointed out the exogeneity assumptions for some of the variables in the simultaneous equations and proposed the Vector Autoregression (VAR) model as an alternative model to the simultaneous equations.
Sims (1980) pointed out the exogeneity assumptions for some of the variables in the simultaneous equations and proposed the Vector Autoregression (VAR) model as an alternative model to the simultaneous equations.
Soru 9
What is a distinctive feature of Vector Autoregression (VAR) models regarding the treatment of variables within the model?
Seçenekler
A
In VAR models, all variables are assumed to follow a linear trend over time.
B
VAR models require all variables to be exogenously determined before analysis.
C
In VAR models, all the variables are assumed as endogenous.
D
VAR models exclusively use stationary variables without requiring any differencing.
E
In VAR models, variables are classified into dependent and independent variables for analysis.
Açıklama:
If your answer is incorrect, please review the “Vector Autoregression Models” section.
Sims (1980) pointed out the exogeneity assumptions for some of the variables in the simultaneous equations and proposed the Vector Autoregression (VAR) model as an alternative model to the simultaneous equations. The VAR models are linear and in VAR models, all the variables are assumed as endogenous.
Sims (1980) pointed out the exogeneity assumptions for some of the variables in the simultaneous equations and proposed the Vector Autoregression (VAR) model as an alternative model to the simultaneous equations. The VAR models are linear and in VAR models, all the variables are assumed as endogenous.
Soru 10
Which of the following best describes the foundation and applications of Vector Autoregression (VAR) models?
Seçenekler
A
VAR models are primarily theoretical models that rely heavily on economic theories for their construction and application.
B
The use of VAR models is restricted to variance decomposition analyses, with limited applicability in other areas of econometrics.
C
VAR models are based on empirical inferences and do not directly depend on economic theories, making them versatile tools for forecasting, causality, impulse-response, and variance decomposition analyses.
D
VAR models are exclusively used for impulse-response analysis in macroeconomic policy evaluation, without any relevance to forecasting or causality testing.
E
The construction of VAR models is based on strict assumptions of linearity and stationarity, limiting their use to theoretical research.
Açıklama:
If your answer is incorrect, please review the “Vector Autoregression Models” section.
The VAR models are based on empirical inferences and do not directly depend on economic theories and VAR models are useful econometric tools for forecasting, causality, impulse-response, and variance decomposition analyses.
The VAR models are based on empirical inferences and do not directly depend on economic theories and VAR models are useful econometric tools for forecasting, causality, impulse-response, and variance decomposition analyses.
Ünite 6
Soru 1
Which of the following is NOT listed as an advantage of using panel data?
Seçenekler
A
Increasing the sample size.
B
Improving the degrees of freedom.
C
Expanding the variability in explanatory variables.
D
Guaranteeing the accuracy of predictions.
E
Decreasing the level of multicollinearity among explanatory determinants.
Açıklama:
If your answer is imcorrect, please review the “Introduction” section.
It is generally known that panel data possesses a great deal of benefits. In order to improve the efficiency of econometric estimators when using panel data, it is possible to summarize the key elements as follows: augmenting the sample size, improving the degrees of freedom, expanding the variability in explanatory variables, and decreasing the level of multilinearity among explanatory determinants. Furthermore, through the process of controlling for individual heterogeneity, panel data models are able to successfully handle the problem of heterogeneity biases. When it comes to tracking the dynamics of adjustment, panel data approaches are suitable.
It is generally known that panel data possesses a great deal of benefits. In order to improve the efficiency of econometric estimators when using panel data, it is possible to summarize the key elements as follows: augmenting the sample size, improving the degrees of freedom, expanding the variability in explanatory variables, and decreasing the level of multilinearity among explanatory determinants. Furthermore, through the process of controlling for individual heterogeneity, panel data models are able to successfully handle the problem of heterogeneity biases. When it comes to tracking the dynamics of adjustment, panel data approaches are suitable.
Soru 2
Which of the following is a limitation associated with panel data models?
Seçenekler
A
They cannot handle large datasets.
B
They always require time series data.
C
They are frequently gathered from surveys, which can introduce various biases.
D
They can only be used for microeconometric analysis.
E
They eliminate the need for econometric estimators.
Açıklama:
If your answer is incorrecy, please review the “Introduction” section.
There are a few limitations associated with panel data models. Panel data are frequently gathered from surveys. There are a number of factors that might have an impact on panel data, including design and data collecting problems, measurement errors, the selectivity problem, and typically, a limited temporal dimension.
There are a few limitations associated with panel data models. Panel data are frequently gathered from surveys. There are a number of factors that might have an impact on panel data, including design and data collecting problems, measurement errors, the selectivity problem, and typically, a limited temporal dimension.
Soru 3
What distinguishes panel data from other types of data?
Seçenekler
A
It is only applicable to macroeconometric analysis.
B
It involves monitoring the same individual agents over time.
C
It exclusively focuses on cross-sectional units with low observations.
D
It is a dataset that excludes time series data.
E
It only includes data from nations and cities.
Açıklama:
If your answer is wrong, please review the “Introduction” section.
Panel data is a type of cross-sectional data that has been pooled over a period of time and involves the monitoring of the same individual agents over the course of time. In other words, panel data is a dataset that combines data from time series and cross-sectional data. Units of cross-section might be anything from nations and cities to businesses and households.
Panel data is a type of cross-sectional data that has been pooled over a period of time and involves the monitoring of the same individual agents over the course of time. In other words, panel data is a dataset that combines data from time series and cross-sectional data. Units of cross-section might be anything from nations and cities to businesses and households.
Soru 4
How does panel data contribute to the efficiency of econometric estimators?
Seçenekler
A
By limiting the sample size.
B
By increasing multicollinearity among explanatory determinants.
C
By reducing the variability in explanatory variables.
D
By expanding the sample size and improving the degrees of freedom.
E
By focusing solely on cross-sectional data.
Açıklama:
If your answer is wrong, please review the “Introduction” section.
It is generally known that panel data possesses a great deal of benefits. In order to improve the efficiency of econometric estimators when using panel data, it is possible to summarize the key elements as follows: augmenting the sample size, improving the degrees of freedom, expanding the variability in explanatory variables, and decreasing the level of multilinearity among explanatory determinants. Furthermore, through the process of controlling for individual heterogeneity, panel data models are able to successfully handle the problem of heterogeneity biases. When it comes to tracking the dynamics of adjustment, panel data approaches are suitable.
It is generally known that panel data possesses a great deal of benefits. In order to improve the efficiency of econometric estimators when using panel data, it is possible to summarize the key elements as follows: augmenting the sample size, improving the degrees of freedom, expanding the variability in explanatory variables, and decreasing the level of multilinearity among explanatory determinants. Furthermore, through the process of controlling for individual heterogeneity, panel data models are able to successfully handle the problem of heterogeneity biases. When it comes to tracking the dynamics of adjustment, panel data approaches are suitable.
Soru 5
What recent developments have occurred in theoretical research on panel data analysis?
Seçenekler
A
A decline in the application of econometric approaches to panel data.
B
The establishment of panel unit root tests, panel co-integration studies, and panel Granger causality tests.
C
A complete shift away from using panel data in applied econometric studies.
D
The elimination of the need for panel data models.
E
A focus on using panel data exclusively for microeconometric analysis.
Açıklama:
If your answer is incorrect, please review the “Introduction” section.
In recent years, there has been a proliferation of theoretical research on panel data analysis, particularly with the application of the econometric approaches that are typically employed in time series to panel data. As a consequence of this, panel unit root tests, panel co-integration studies, and panel Granger causality tests have been established within the scope of the theoretical framework. In tandem with these improvements, there has been a rise in the number of applied econometric studies that are based on panel data sets.
In recent years, there has been a proliferation of theoretical research on panel data analysis, particularly with the application of the econometric approaches that are typically employed in time series to panel data. As a consequence of this, panel unit root tests, panel co-integration studies, and panel Granger causality tests have been established within the scope of the theoretical framework. In tandem with these improvements, there has been a rise in the number of applied econometric studies that are based on panel data sets.
Soru 6
What is a common issue associated with the collection of panel data?
Seçenekler
A
It is always collected digitally, leading to high costs.
B
It cannot be collected from businesses and households.
C
It involves only the monitoring of nations and cities over time.
D
Surveys used to gather panel data can introduce biases and other problems.
E
Panel data collection does not involve any time dimension.
Açıklama:
If your answer is incorrect, please review the “Introduction” section.
There are a few limitations associated with panel data models. Panel data are frequently gathered from surveys. There are a number of factors that might have an impact on panel data, including design and data collecting problems, measurement errors, the selectivity problem, and typically, a limited temporal dimension.
There are a few limitations associated with panel data models. Panel data are frequently gathered from surveys. There are a number of factors that might have an impact on panel data, including design and data collecting problems, measurement errors, the selectivity problem, and typically, a limited temporal dimension.
Soru 7
What assumption is made in a random effect model regarding individual effects and regressors?
Seçenekler
A
Individual effects are perfectly correlated with regressors.
B
Each individual effect has a strong correlation with every regressor.
C
Individual effects are assumed to have no correlation with any regressor.
D
Regressors are considered time-invariant across all individuals.
E
Individual effects and regressors are always constant over time.
Açıklama:
If your answer is incorrect, please review the “Panel Data Models” section.
A random effect model makes the assumption that each individual effect has no correlation with any regressor, and then it estimates the error variance that is specific to certain groups.
A random effect model makes the assumption that each individual effect has no correlation with any regressor, and then it estimates the error variance that is specific to certain groups.
Soru 8
What is assumed in a pooled panel data model regarding intercept and slope coefficients?
Seçenekler
A
They vary significantly across individuals and time.
B
They remain constant across time but vary across individuals.
C
They remain the same throughout time and space.
D
Only the slope coefficients are assumed to be constant.
E
Intercept coefficients are variable, while slope coefficients are constant.
Açıklama:
If your answer is incorrect, please review the “Panel Data Models” section.
In a pooled panel data model intercept and slope coefficients are assumed to remain the same throughout time and space.
In a pooled panel data model intercept and slope coefficients are assumed to remain the same throughout time and space.
Soru 9
Why is the OLS estimator considered biased and inconsistent in the context of fixed effect models?
Seçenekler
A
Because it perfectly predicts the dependent variable without any error.
B
Because it assumes that all variables of interest are observed and included in the model.
C
Because it does not account for individual-specific effects that are correlated with the regressors.
D
Because it only uses cross-sectional data, ignoring the time series component.
E
Because it assumes that the error terms are perfectly correlated with the regressors.
Açıklama:
If your answer is incorrect, please review the “Panel Data Models” section.
The fixed effect model can be defined as follows: yit = ai + x'itβ +εit where ai defines all individual-specific effects. The OLS estimator is biased and inconsistent because of the bias caused by omitted variables.
The fixed effect model can be defined as follows: yit = ai + x'itβ +εit where ai defines all individual-specific effects. The OLS estimator is biased and inconsistent because of the bias caused by omitted variables.
Soru 10
What does LSDV stand for in the context of estimating the parameters of fixed effect models?
Seçenekler
A
Least Squares Determinant Variable
B
Linear Squares Derivative Variable
C
Least Squares Dummy Variable
D
Linear Systematic Deviation Variable
E
Least Significant Dependent Variable
Açıklama:
If your answer is incorrect, please review the “Panel Data Models” section.
LSDV, which stands for least squares dummy variable, is a technique that is frequently utilized in practice for the purpose of estimating the parameters of fixed-effects models.
LSDV, which stands for least squares dummy variable, is a technique that is frequently utilized in practice for the purpose of estimating the parameters of fixed-effects models.
Ünite 7
Soru 1
What does the expression E[ Y(1) - Y(0) | D = 1 ] = E[ Y | D = 1 ] - E[ Y | D = 0 ] represent in the context of difference-in-differences (DiD) method?
Seçenekler
A
It represents the average treatment effect on the treated, comparing the expected outcomes of the treated group before and after the treatment to the control group's outcomes in the same periods.
B
It denotes the average treatment effect for the entire population, not just the treated.
C
It indicates the difference in outcomes within the treated group only, without comparison to any control group.
D
It is a formula used to calculate the variance of the treatment effect.
E
It represents the interaction effect of treatment and time in a regression model.
Açıklama:
If your answer is wrong, please review the “Introduction” section.
The explanation and proof of ATET: E[Y(1) - Y(0) | D = 1] = E[Y | D = 1] - E[Y | D = 0] is provided under 1YOUr Turn 1" The answer explains that this expression represents the average treatment effect on the treated (ATET) by comparing the expected outcomes for the treated group under treatment and the expected outcomes if they had not been treated, using the outcomes of the control group as a reference for what would have happened to the treated group in the absence of treatment.
The explanation and proof of ATET: E[Y(1) - Y(0) | D = 1] = E[Y | D = 1] - E[Y | D = 0] is provided under 1YOUr Turn 1" The answer explains that this expression represents the average treatment effect on the treated (ATET) by comparing the expected outcomes for the treated group under treatment and the expected outcomes if they had not been treated, using the outcomes of the control group as a reference for what would have happened to the treated group in the absence of treatment.
Soru 2
What does the consistency assumption imply in the context of the Difference-in-Differences (DiD) method according to the provided document?
Seçenekler
A
It implies that the treatment effect is consistent across different time periods.
B
It suggests that the observed value of an outcome is equal to the potential outcome if the treatment status is the same as the observed treatment status.
C
It indicates that the treatment effect must be consistent across different subgroups within the study.
D
It requires that the treatment assignment must be random.
E
It assumes that the error terms in the regression model are homoscedastic.
Açıklama:
If your answer is wrong, please review the “Assumptions of the Difference-in-Differences” section.
The explanation of the consistency assumption is provided under the section "Assumptions of the Difference-in-Differences" It states: "For every time period t, and treatment status D = d, the observed value of an outcome is equal to the potential outcome which is Y_t = Y_t(d)." This assumption implies that the causal estimand identified can be estimated in the data and will be the statistical estimand. For example, E[Y_0(0) | D = 0] = E[Y_0 | D = 0] is used to illustrate how the average potential outcome under no treatment for the control group can be observed and identified in the data.
The explanation of the consistency assumption is provided under the section "Assumptions of the Difference-in-Differences" It states: "For every time period t, and treatment status D = d, the observed value of an outcome is equal to the potential outcome which is Y_t = Y_t(d)." This assumption implies that the causal estimand identified can be estimated in the data and will be the statistical estimand. For example, E[Y_0(0) | D = 0] = E[Y_0 | D = 0] is used to illustrate how the average potential outcome under no treatment for the control group can be observed and identified in the data.
Soru 3
In the context of the Difference-in-Differences (DiD) method, what does the consistency assumption ensure about the observed outcomes?
Seçenekler
A
It ensures that the treatment effects are consistent across different geographical locations.
B
It guarantees that the treatment effects are the same in both pre-treatment and post-treatment periods.
C
It ensures that the observed outcomes are equal to the potential outcomes if the treatment status matches the observed status.
D
It ensures that all units receive the treatment at the same time.
E
It guarantees that the treatment has no spillover effects on the control group.
Açıklama:
If your answer is wrong, please review the "Assumptions of the Difference-in-Differences" section
"For every time period t, and treatment status D = d, the observed value of an outcome is equal to the potential outcome which is Y_t = Y_t(d)." This assumption is crucial as it implies that the causal estimand that we identify can be estimated in our data and it will be our statistical estimand. For instance, E[Y_0(0) | D = 0] = E[Y_0 | D = 0] demonstrates how the average potential outcome under no treatment for the control group can be observed and identified in the data.
"For every time period t, and treatment status D = d, the observed value of an outcome is equal to the potential outcome which is Y_t = Y_t(d)." This assumption is crucial as it implies that the causal estimand that we identify can be estimated in our data and it will be our statistical estimand. For instance, E[Y_0(0) | D = 0] = E[Y_0 | D = 0] demonstrates how the average potential outcome under no treatment for the control group can be observed and identified in the data.
Soru 4
What role does the consistency assumption play in the calculation of the Average Treatment Effect on the Treated (ATET) in the Difference-in-Differences (DiD) framework according to the document?
Seçenekler
A
It ensures that the treatment effect is consistent over different population subgroups.
B
It guarantees that the treatment effect remains stable over multiple time periods.
C
It confirms that the observed outcomes for a given treatment status are equivalent to the potential outcomes for that status.
D
It ensures that the treatment effect is uniformly distributed across all units.
E
It verifies that the treatment assignment is random and unbiased.
Açıklama:
If your answer is wrong, please review the “Assumptions of the Difference-in-Differences” section.
The explanation of the consistency assumption is provided under the section "Assumptions of the Difference-in-Differences." It states: "For every time period t, and treatment status D = d, the observed value of an outcome is equal to the potential outcome which is Y_t = Y_t(d)." This assumption is crucial as it implies that the causal estimand that we identify can be estimated in our data and it will be our statistical estimand. For example, E[Y_0(0) | D = 0] = E[Y_0 | D = 0] is used to illustrate how the average potential outcome under no treatment for the control group can be observed and identified in the data. This is essential for calculating the ATET as it relies on comparing the observed outcomes with the potential outcomes under different treatment statuses.
The explanation of the consistency assumption is provided under the section "Assumptions of the Difference-in-Differences." It states: "For every time period t, and treatment status D = d, the observed value of an outcome is equal to the potential outcome which is Y_t = Y_t(d)." This assumption is crucial as it implies that the causal estimand that we identify can be estimated in our data and it will be our statistical estimand. For example, E[Y_0(0) | D = 0] = E[Y_0 | D = 0] is used to illustrate how the average potential outcome under no treatment for the control group can be observed and identified in the data. This is essential for calculating the ATET as it relies on comparing the observed outcomes with the potential outcomes under different treatment statuses.
Soru 5
What is the primary purpose of introducing time into the notation of outcomes in the Canonical Difference-in-Differences (DiD) setting?
Seçenekler
A
To adjust for inflation over different time periods.
B
To observe the outcomes of treatment and control groups at multiple time points.
C
To compare the outcomes of different geographical locations over time.
D
To measure the variability of outcomes within the same group.
E
To ensure that the treatment effects are consistent across different subgroups.
Açıklama:
If your answer is wrong, please review the “Canonical Difference-in-Differences” section.
The introduction of time into the notation where Yit is the outcome for unit i at time t, let’s the researcher observing outcomes at two time periods (pre-treatment and post-treatment).
The introduction of time into the notation where Yit is the outcome for unit i at time t, let’s the researcher observing outcomes at two time periods (pre-treatment and post-treatment).
Soru 6
What does the Canonical Difference-in-Differences setting typically involve in terms of observation periods?
Seçenekler
A
Observing outcomes over five consecutive years.
B
Comparing outcomes before and after the treatment in a single time period.
C
Observing outcomes at two time periods, pre-treatment and post-treatment.
D
Continuous monitoring of outcomes throughout the treatment.
E
Annual assessment of outcomes post-treatment.
Açıklama:
If your answer is wrong, please review the “Canonical Difference-in-Differences” section.
In a simple 2x2 DiD setting, outcomes for treatment and control groups are observed at two time periods: pre-treatment and post-treatment.
In a simple 2x2 DiD setting, outcomes for treatment and control groups are observed at two time periods: pre-treatment and post-treatment.
Soru 7
In the Canonical Difference-in-Differences example involving Card and Krueger (1994), what policy change was analyzed?
Seçenekler
A
Changes in healthcare legislation.
B
Introduction of a new educational curriculum.
C
Impact of minimum wage introduction in New Jersey.
D
Effects of a new tax law.
E
Implementation of a new public transportation system.
Açıklama:
If your answer is wrong, please review the “Canonical Difference-in-Differences” section.
The example of Card and Krueger (1994) is discussed under " Canonical Difference-in-Differences" where they analyze the impact of minimum wage introduction in New Jersey on employment.
The example of Card and Krueger (1994) is discussed under " Canonical Difference-in-Differences" where they analyze the impact of minimum wage introduction in New Jersey on employment.
Soru 8
What does t=0 in the Difference-in-Differences (DiD) setting describe?
Seçenekler
A
The period during the treatment.
B
The post-treatment period.
C
The pre-treatment period.
D
The recovery period after treatment.
E
The initial period.
Açıklama:
Canonical Difference-in-Differences
The text states, "Let’s assume that t = 0 is the pre-treatment period and t = 1 is the period after the treatment (i.e., the post-treatment period)."
The text states, "Let’s assume that t = 0 is the pre-treatment period and t = 1 is the period after the treatment (i.e., the post-treatment period)."
Soru 9
In the DiD framework, what does E[Y1 ∣D=1] represent?
Seçenekler
A
The expected value of the outcome for the untreated group in the post-treatment period.
B
The expected value of the outcome for the treated group in the pre-treatment period.
C
The expected value of the outcome for the treated group in the post-treatment period.
D
The average treatment effect on the treated.
E
The potential outcome of the treated group if they had not received the treatment.
Açıklama:
If your answer is wrong, please review the “Canonical Difference-in-Differences” section.
So, E[Y1 ∣D=1] is the expected value of the outcome (or average outcome) for the treatment group (D = 1) in the post-treatment period (t = 1).
So, E[Y1 ∣D=1] is the expected value of the outcome (or average outcome) for the treatment group (D = 1) in the post-treatment period (t = 1).
Soru 10
In the DiD analysis, what does the term "counterfactual" refer to?
Seçenekler
A
The observed outcome of the treatment group in the post-treatment period.
B
The observed outcome of the control group in the post-treatment period.
C
The potential outcome of the treated group in the post-treatment period if they had not received the treatment.
D
The difference in outcomes between the pre-treatment and post-treatment periods.
E
The average treatment effect on the treated.
Açıklama:
If your answer is wrong, please review the “Canonical Difference-in-Differences” section.
The document explains, "This implies that to find the ATET, we need to know the counterfactual, which is the E[Y1 (0)∣T=1] (i.e., the potential outcome of the treated group in the post-treatment period if they had not received the treatment)."
The document explains, "This implies that to find the ATET, we need to know the counterfactual, which is the E[Y1 (0)∣T=1] (i.e., the potential outcome of the treated group in the post-treatment period if they had not received the treatment)."
Ünite 8
Soru 1
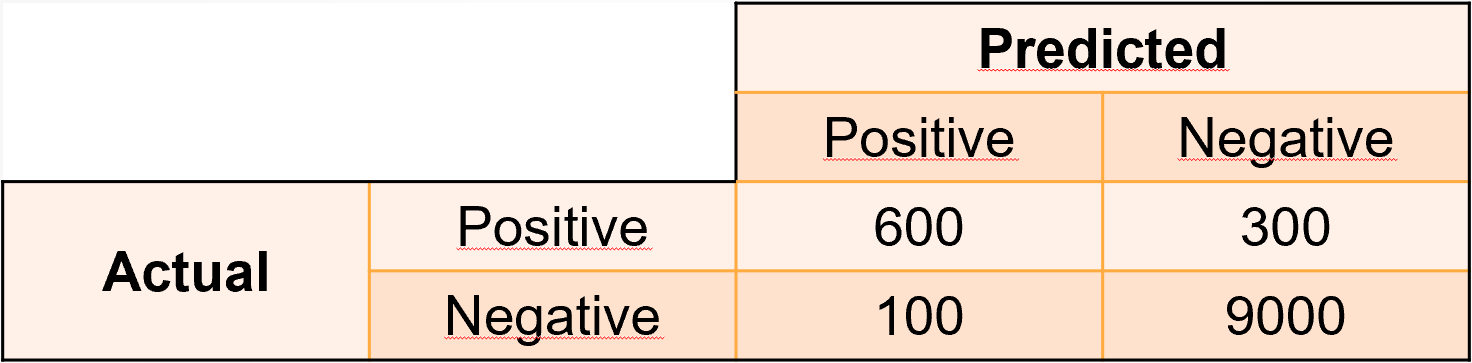 Given the confusion matrix above, what is the accuracy of the related classification model?
Seçenekler
A
0.960
B
0.667
C
0.857
D
0.750
E
0.968
Açıklama:
If your answer is wrong, please review the “Predictive Measures” section.
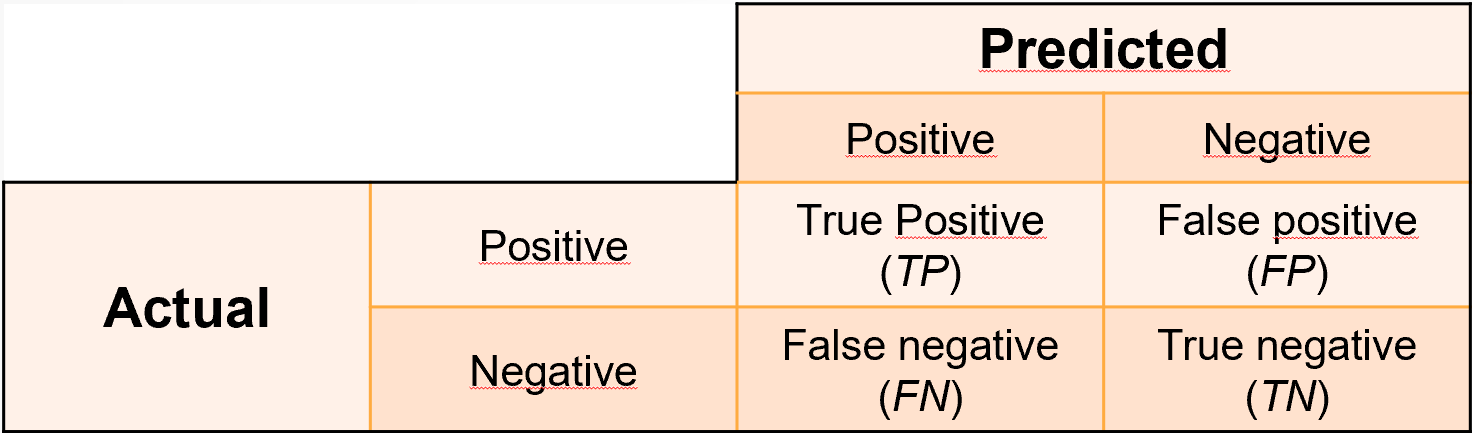 Accuracy = (TP+TN) / (TP+FP+TN+FN)
Accuracy = 9600 / 10000 = 0.960
Accuracy = (TP+TN) / (TP+FP+TN+FN)Accuracy = 9600 / 10000 = 0.960
Soru 2
Given the confusion matrix above, what is the precision of the related classification model?Seçenekler
A
0.960
B
0.667
C
0.857
D
0.750
E
0.968
Açıklama:
If your answer is wrong, please review the “Predictive Measures” section.
Precision = TP / (TP+FP)
Precision = 600 / 900 = 0.667
Precision = TP / (TP+FP)Precision = 600 / 900 = 0.667
Soru 3
Given the confusion matrix above, what is the recall of the related classification model?Seçenekler
A
0.960
B
0.667
C
0.857
D
0.750
E
0.968
Açıklama:
If your answer is wrong, please review the “Predictive Measures” section.
Recall = TP / (TP+FN)
Recall = 600 / 700 = 0.857
Recall = TP / (TP+FN)Recall = 600 / 700 = 0.857
Soru 4
Given the confusion matrix above, what is the F1 score of the related classification model?Seçenekler
A
0.960
B
0.667
C
0.857
D
0.750
E
0.968
Açıklama:
If your answer is wrong, please review the “Predictive Measures” section.
F1 score = (2×Precision×Recall) / (Precision+Recall)
F1 score = (2×0.667×0.857) / (0.667+0.857) = 0.750
F1 score = (2×Precision×Recall) / (Precision+Recall)F1 score = (2×0.667×0.857) / (0.667+0.857) = 0.750
Soru 5
Given the confusion matrix above, what is the specificity of the related classification model?Seçenekler
A
0.960
B
0.667
C
0.857
D
0.750
E
0.968
Açıklama:
If your answer is wrong, please review the “Predictive Measures” section.
Specificity = TN / (TN+FP)
Specificity = 9000 / 9300 = 0.968
Specificity = TN / (TN+FP)Specificity = 9000 / 9300 = 0.968
Soru 6
Given the confusion matrix above, what is the recall of the related classification model?Seçenekler
A
0.032
B
0.072
C
0.143
D
0.333
E
0.667
Açıklama:
If your answer is wrong, please review the “Predictive Measures” section.
False Positive Rate = FP / (TN+FP)
False Positive Rate = 300 / 9300 = 0.032
False Positive Rate = FP / (TN+FP)False Positive Rate = 300 / 9300 = 0.032
Soru 7
Which performance measure is most appropriate for balanced datasets?
Seçenekler
A
Precision
B
Recall
C
F1 Score
D
Specificity
E
Accuracy
Açıklama:
If your answer is wrong, please review the “Predictive Measures” section.
Accuracy must be used for balanced datasets where classes are evenly distributed. However, it may be misleading in imbalanced datasets.
Accuracy must be used for balanced datasets where classes are evenly distributed. However, it may be misleading in imbalanced datasets.
Soru 8
In which scenario is Precision particularly relevant?
Seçenekler
A
When the dataset is balanced.
B
When minimizing false negatives is critical.
C
When the cost of false positives is high.
D
When there is a need to balance precision and recall.
E
When incorrectly identifying negatives as positives has significant consequences.
Açıklama:
If your answer is wrong, please review the “Predictive Measures” section.
Precision emphasizes minimizing false positives. It is relevant in scenarios where the cost of false positives is high.
Precision emphasizes minimizing false positives. It is relevant in scenarios where the cost of false positives is high.
Soru 9
What is the primary benefit of using the F1 Score in model evaluation?
Seçenekler
A
It minimizes false positives.
B
It is useful for balanced datasets.
C
It balances precision and recall, especially in imbalanced datasets.
D
It emphasizes minimizing false negatives.
E
It complements Specificity by focusing on true negatives.
Açıklama:
If your answer is wrong, please review the “Predictive Measures” section.
The F1 score is useful when there is a need to balance precision and recall. It is particularly useful in imbalanced datasets.
The F1 score is useful when there is a need to balance precision and recall. It is particularly useful in imbalanced datasets.
Soru 10
Which performance measure should be prioritized when the identification of negatives correctly is crucial?
Seçenekler
A
Accuracy
B
Precision
C
Recall
D
Specificity
E
F1 Score
Açıklama:
If your answer is wrong, please review the “Predictive Measures” section.
Specificity emphasizes minimizing false negatives in negative predictions and it should be used in cases when correctly identifying negatives is critical.
Specificity emphasizes minimizing false negatives in negative predictions and it should be used in cases when correctly identifying negatives is critical.