Econometrıcs I (ENG) - Tüm Sorular
Ünite 1
Soru 1
A ------------------------- is a characteristic or value that is used to define or describe a system, process, or function.
Which of the following completes the sentence above?
Which of the following completes the sentence above?
Seçenekler
A
Parameter
B
Hypotheses
C
Observation
D
Substitution
E
Estimation
Açıklama:
In general, a parameter is a characteristic
or value that is used to define or describe
a system, process, or function. In a linear
regression model, the slope and intercept of
the line are parameters that determine the
relationship between two variables.
Parameter
or value that is used to define or describe
a system, process, or function. In a linear
regression model, the slope and intercept of
the line are parameters that determine the
relationship between two variables.
Parameter
Soru 2
----------------- is the process of drawing
conclusions about a population based on
sample data.
Which of the following completes the sentence above?
conclusions about a population based on
sample data.
Which of the following completes the sentence above?
Seçenekler
A
Economics
B
Hypothesis
C
Statistical inference
D
Econometric inference
E
Parameters
Açıklama:
Statistical inference is the process of drawing
conclusions about a population based on
sample data. It involves using probability
theory and statistical techniques to make
inferences about a population parameter
based on sample data.
conclusions about a population based on
sample data. It involves using probability
theory and statistical techniques to make
inferences about a population parameter
based on sample data.
Soru 3
Which of the following statements is true about the three disciplines on which econometrics is built?
Seçenekler
A
mathematics, and statistics
B
economic theory
C
statistics
D
economic theory, mathematics, and statistics
E
economic theory, and mathematics
Açıklama:
the intersection of economic
theory and mathematics represents mathematical economics, the intersection of economic theory and
statistics represents economic statistics, the intersection of mathematics and statistics is mathematical
statistics, and the intersection of all three represents
econometrics.
economic theory, mathematics, and statistics
Soru 4
Why is the parameter needed in econometric analysis?
Seçenekler
A
To make policy decisions
B
to define a system, process, or function.
C
To predict inflation rate
D
To learn about income level
E
To predict of sales-based advertising
Açıklama:
a parameter is a characteristic
or value that is used to define or describe
a system, process, or function. In a linear
regression model, the slope and intercept of
the line are parameters that determine the
relationship between two variables.
to define a system, process, or function.
or value that is used to define or describe
a system, process, or function. In a linear
regression model, the slope and intercept of
the line are parameters that determine the
relationship between two variables.
to define a system, process, or function.
Soru 5
Which of the following is not about learning about econometrics?
Seçenekler
A
Making informed policy decisions
B
Understanding economic relationships
C
Forecasting economic conditions
D
Enhancing writing skills
E
Testing economic theories
Açıklama:
There are several reasons why we learn
econometrics:
1- Understanding economic relationships:
Econometrics enables us to realize the
complicated interactions that exist
between economic variables, such as
the relationship between inflation
and unemployment, the influence of
education on income, or the influence of
advertisement on sales.
2- Testing economic theories: Econometrics
helps us test economic theories by figuring
out how economic variables relate to each
other and by providing evidence for or
against economic hypotheses.
3- Making informed policy decisions:
Econometrics provides policymakers with
the tools they need to examine economic
data and make educated judgments on
economic policy, such as interest rate
setting, fiscal policy implementation, and
industry regulation.
4- Forecasting economic conditions: Based
on past data and economic models,
econometrics enables us to forec
Enhancing writing skills
Soru 6
What is the difference between econometrics and economics?
Seçenekler
A
Econometrics responsibility is to give such written report
B
Econometrics takes the model derived from daily life
C
Econometrics provides theoric content
D
Econometrics the main substitute of economics
E
Econometrics involves the mathematical modeling of economic events
Açıklama:
Econometrics involves the mathematical modeling of economic events
Soru 7
Which of the following is not generally included in the study of econometrics?
Seçenekler
A
A restaurant might want to assess the
effectiveness of its recent advertising
campaign in boosting sales.
effectiveness of its recent advertising
campaign in boosting sales.
B
Macroeconomists may seek to evaluate the
efficacy of various government policies.
efficacy of various government policies.
C
Developing new social relationships.
D
Almost every business might want to know
how their profits change as they expand.
how their profits change as they expand.
E
Both government and private experts
should be interested in the price and
income elasticity of demand.
should be interested in the price and
income elasticity of demand.
Açıklama:
Some examples
of the use of econometrics in real life are given
below:
• A restaurant might want to assess the
effectiveness of its recent advertising
campaign in boosting sales.
• Both government and private experts
should be interested in the price and
income elasticity of demand.
• Almost every business might want to know
how their profits change as they expand.
• Both tobacco companies and medical
researchers should aim to determine the
impact of the Ministry of Health’s smoking
and lung cancer report on smoking rates.
• Macroeconomists may seek to evaluate the
efficacy of various government policies.
• A public utilities commission should aim
to determine the impact of regulations
mandating improved insulation on energy
consumption.
• The government might want to find out
the impact of stricter drinking and driving
regulations on the number of related deaths
and injuries.
• A pr
Developing new social relationships.
Soru 8
-------------------- is a statistical method
used to investigate the relationship between
a dependent variable (also known as
the explained variable) and one or more
independent variables (also known as the
explanatory variables).
Which of the following completes the sentence above?
used to investigate the relationship between
a dependent variable (also known as
the explained variable) and one or more
independent variables (also known as the
explanatory variables).
Which of the following completes the sentence above?
Seçenekler
A
Obtaining data
B
Regression analysis
C
Hypothesis Testing
D
Forecasting
E
Prediction
Açıklama:
Regression analysis is a statistical method
used to investigate the relationship between
a dependent variable (also known as
the explained variable) and one or more
independent variables (also known as the
explanatory variables).
used to investigate the relationship between
a dependent variable (also known as
the explained variable) and one or more
independent variables (also known as the
explanatory variables).
Soru 9
------------------- involves using sample data to
estimate the value of a population parameter,
along with a measure of uncertainty.
Which of the following completes the sentence above?
estimate the value of a population parameter,
along with a measure of uncertainty.
Which of the following completes the sentence above?
Seçenekler
A
Forecasting
B
Prediction
C
Hypothesis testing
D
Uncertainty.
E
Estimation
Açıklama:
Estimation involves using sample data to
estimate the value of a population parameter,
along with a measure of uncertainty.
estimate the value of a population parameter,
along with a measure of uncertainty.
Soru 10
Which data type consists of data on one or more variables collected at the same point in time?
Seçenekler
A
A cross-sectional
B
Time series
C
Nonexperimental
D
User
E
Cost
Açıklama:
Cross-sectional data refers to data collected
at a specific point in time, typically from a
sample or population.
Cross-sectional data are data on one or more variables collected at the same point in time, such as GDP of OECD member countries in 2023,
olive production of the cities in Aegean region in 2022, or the distribution of COVID-19 vaccines conducted on a specific day.
Ünite 2
Soru 1
Which of the following steps are necessary for derivation of the formulas for the estimation of parameters?
I. Derive the objective function
II. Optimize the objective function
III. Maximize the objective function
IV. Simplify the estimators
I. Derive the objective function
II. Optimize the objective function
III. Maximize the objective function
IV. Simplify the estimators
Seçenekler
A
I, II, and III
B
I, II, and IV
C
II, III, and IV
D
I, and II
E
I, and IV
Açıklama:
- Derive the objective function.
- Optimize the objective function.
- Simplify the estimators
- Derive the objective function.
- Optimize the objective function.
- Simplify the estimators
Soru 2
The aim in the OLS method is to find estimators for ------------------ that minimize the sum of squared errors.
Which of the following completes the sentence above?
Which of the following completes the sentence above?
Seçenekler
A
∂
B
C
C
β
D
u
E
f
Açıklama:
β
Soru 3
In regression, the ------------------------------is the starting point for the econometric model.
Which of the following completes the sentence above?
Which of the following completes the sentence above?
Seçenekler
A
Mathematical model
B
Statistical model
C
Probit model
D
Logit model
E
ARIMA model
Açıklama:
Mathematical model
Soru 4
Which of the following is not included in the the assumptions of OLS estimators?
Seçenekler
A
Homoscedasticity or equal variance of ui . All error terms have to have the same variance, technically, var(ui |Xi ) = σ2.
B
Zero average (mean) value of error term ui . Technically, the conditional mean value of ui is zero, E(ui |Xi ) = 0.
C
Autocorrelation or serial correlation between the disturbances.
D
The number of observations n must be greater than the number of parameters to be estimated.
E
Zero covariance between ui and Xi . There should not be a relation between these two terms.
Açıklama:
Autocorrelation or serial correlation between the disturbances.
Soru 5
Which of the following is based on all the observations?
Seçenekler
A
Data
B
Observation
C
Sample
D
Variable
E
Determinant
Açıklama:
Data
Soru 6
Which of the following is not included in the alternative names of independent variable?
Seçenekler
A
Explanatory variable
B
Regressor
C
Exogenous variable
D
Predictor
E
Response variable
Açıklama:
Response variable
Soru 7
Which of the following is not included in the alternative names of dependent variable?
Seçenekler
A
Explained variable
B
Regressand
C
Predictand
D
Control variable
E
Endogenous variable
Açıklama:
Control variable
Soru 8
Which of the following statements is true about the simple linear regression model?
Seçenekler
A
The model has one dependent variable
B
The model has one independent variable
C
The model has one dependent variable and one independent variable
D
The model has no variable
E
The model has one sample and one observation variable
Açıklama:
The model has one dependent variable and one independent variable
Soru 9
a ------------------------- is a subset or smaller representation of the population.
Which of the following completes the sentence above?
Which of the following completes the sentence above?
Seçenekler
A
Population
B
Statistic
C
Data
D
Sample
E
Observation
Açıklama:
A sample is a subset or smaller representation of the population.
Soru 10
a ------------------------- refers to the entire set of individuals, objects, or events that you are interested in studying or making inferences about.
Which of the following completes the sentence above?
Which of the following completes the sentence above?
Seçenekler
A
Population
B
Sample
C
Observation
D
Data
E
Cofficient
Açıklama:
Sample
a population refers to the entire set of individuals, objects, or events that you are interested in studying or making inferences about. It represents the complete group that you want to draw conclusions about.
a population refers to the entire set of individuals, objects, or events that you are interested in studying or making inferences about. It represents the complete group that you want to draw conclusions about.
Ünite 3
Soru 1
Which of the following is a predictive analysis method that examines the relationship between a dependent variable and several independent variables?
Seçenekler
A
Multiple regression
B
Single regression
C
Autoregressive regression
D
Threshold autoregressive regression
E
Autoregressive moving average regression
Açıklama:
The correct answer is option A.
"Multiple regression is a predictive analysis technique that investigates the relationship between
a dependent variable and several independent variables."
"Multiple regression is a predictive analysis technique that investigates the relationship between
a dependent variable and several independent variables."
Soru 2
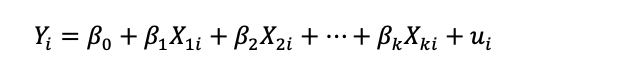 Which of the following is the dependent variable of the above regression equation?
Seçenekler
A 
B 
C 
D 
E 
Açıklama:
The correct answer is option A.
" Yi is the dependent variable"
" Yi is the dependent variable"
Soru 3
Which of the following assumption of the multiple linear regression is also referred to as exogeneity?
Seçenekler
A
There is no systematic relationship between the independent variables and the error term.
B
There is a linear relationship between the independent and dependent variables.
C
The expected value of the error term is zero.
D
There is no correlation between the error terms of different observations.
E
The model is correctly specified.
Açıklama:
The correct answer is option A.
"
Assumption(A3) is that there are no correlations between the independent variables and the error term. This means that the independent variables and the error term are independent of each other, and there is no systematic relationship between them. This assumption is also referred to as exogeneity.
"
"
Assumption(A3) is that there are no correlations between the independent variables and the error term. This means that the independent variables and the error term are independent of each other, and there is no systematic relationship between them. This assumption is also referred to as exogeneity.
"
Soru 4
Which of the following represents an assumption of multiple linear regression?
Seçenekler
A
Homoscedasticity
B
Heteroscedasticity
C
Non-linearity
D
Endogeneity
E
Non-normality
Açıklama:
"Assumption (A4) means that the variance of the residuals should be constant across all levels of the independent variables. In other words, the spread of the residuals should be similar for all values of the independent variables, without any discernible pattern. This assumption is known as homoscedasticity." The homoscedasticity is an assumption of multiple linear regression.
The other options do not represent the assumptions of multiple linear regression.
The correct answer is option A.
"Assumption (A4) means that the variance of the residuals should be constant across all levels of the independent variables. In other words, the spread of the residuals should be similar for all values of the independent variables, without any discernible pattern. This assumption is known as homoscedasticity." The homoscedasticity is an assumption of multiple linear regression.
The other options do not represent any assumption of multiple linear regression.
Soru 5
Which of the following method is a foundational statistical technique used to estimate the parameters of a linear regression model by minimizing the sum of the squared differences between observed and predicted values?
Seçenekler
A
OLS
B
MM
C
GMM
D
ML
E
GML
Açıklama:
"
The Ordinary Least Squares (OLS) method is a foundational statistical technique used to estimate the parameters of a linear regression model by minimizing the sum of the squared diferences between observed and predicted values.
"
The correct answer is option A.
"
The Ordinary Least Squares (OLS) method is a foundational statistical technique used to estimate the parameters of a linear regression model by minimizing the sum of the squared diferences between observed and predicted values.
"
The Ordinary Least Squares (OLS) method is a foundational statistical technique used to estimate the parameters of a linear regression model by minimizing the sum of the squared diferences between observed and predicted values.
"
The correct answer is option A.
"
The Ordinary Least Squares (OLS) method is a foundational statistical technique used to estimate the parameters of a linear regression model by minimizing the sum of the squared diferences between observed and predicted values.
"
Soru 6
…………………. is the commonly used measure of goodness of fit in multiple regression.
Which of the following completes the sentence above?
Which of the following completes the sentence above?
Seçenekler
A 
B
RSS
C
ESS
D
TSS
E
GLS
Açıklama:
The correct answer is option A.
" R² is the commonly used measure of goodness of fit in multiple regression"
" R² is the commonly used measure of goodness of fit in multiple regression"
Soru 7
What does the OLS method purpose to minimize while estimating the models’ coefficients?
Seçenekler
A
RSS
B
TSS
C
ESS
D
MAE
E
Residuals
Açıklama:
The correct answer is option A.
"
The OLS method, used to estimate the model’s coefficients, minimizes the RSS.
"
"
The OLS method, used to estimate the model’s coefficients, minimizes the RSS.
"
Soru 8
Which of the following estimator exhibit “BLUE” feature under the Gauss Markov Theorem?
Seçenekler
A
OLS
B
MM
C
GMM
D
ML
E
GML
Açıklama:
The correct answer is option A.
"
The Gauss Markow theorem shows that if a certain set of assumptions are valid, the OLS estimator for regression coefficients give you the best linear unbiased estimate (BLUE) possible
"
"
The Gauss Markow theorem shows that if a certain set of assumptions are valid, the OLS estimator for regression coefficients give you the best linear unbiased estimate (BLUE) possible
"
Soru 9
Which of the following theorem state that the OLS estimator is “BLUE” under certain conditions?
Seçenekler
A
Gauss Markov Theorem
B
Granger Representation Theorem
C
Mann-Wald theorem
D
Taylor theorem
E
Cramér-Wold theorem
Açıklama:
The correct answer is option A.
Soru 10
Which of the following term is used to describe a situation in multiple regression analysis when there is an exact relationship between two or more independent variables?
Seçenekler
A
Perfect multicollinearity
B
Perfect linearity
C
Exact identification
D
Weak exogeneity
E
Homoscedasticity
Açıklama:
The correct answer is option A.
"
If there is an exact linear relationship between two or more independent variables in a multiple regression model, this situation is referred to as perfect multicollinearity
"
"
If there is an exact linear relationship between two or more independent variables in a multiple regression model, this situation is referred to as perfect multicollinearity
"
Ünite 4
Soru 1
………… is a statistical technique used to draw meaningful conclusions about the relationship between a dependent variable and multiple independent variables.
Which of the following completes the sentence above?
Which of the following completes the sentence above?
Seçenekler
A
Inference
B
Estimation
C
Prediction
D
Forecasting
E
Identification
Açıklama:
"
Inference for regression is a statistical technique used to draw meaningful conclusions about the relationship between a dependent variable and multiple independent variables.
"
The correct answer is option A.
"
Inference for regression is a statistical technique used to draw meaningful conclusions about the relationship between a dependent variable and multiple independent variables.
"
Inference for regression is a statistical technique used to draw meaningful conclusions about the relationship between a dependent variable and multiple independent variables.
"
The correct answer is option A.
"
Inference for regression is a statistical technique used to draw meaningful conclusions about the relationship between a dependent variable and multiple independent variables.
"
Soru 2
Which of the following fields commonly use the regression analysis?
Seçenekler
A
Economics
B
Astrophysics
C
Chemistry
D
Sociology
E
Communication sciences
Açıklama:
"
Regression analysis is commonly used in various fields, such as economics, finance, engineering, social sciences, and healthcare, to model the relationships between variables and make predictions or forecast future outcomes.
"
The correct answer is option A.
"
Regression analysis is commonly used in various fields, such as economics, finance, engineering, social sciences, and healthcare, to model the relationships between variables and make predictions or forecast future outcomes.
"
Regression analysis is commonly used in various fields, such as economics, finance, engineering, social sciences, and healthcare, to model the relationships between variables and make predictions or forecast future outcomes.
"
The correct answer is option A.
"
Regression analysis is commonly used in various fields, such as economics, finance, engineering, social sciences, and healthcare, to model the relationships between variables and make predictions or forecast future outcomes.
"
Soru 3
Which of the following is not a step in inference for regression?
Seçenekler
A
Selecting variables for the regression analysis
B
Testing hypothesis
C
Estimating the magnitude and the direction of the relationship
D
Assessing the fit of the regression model
E
Assessing the predictive power of the regression model
Açıklama:
"
Inference for regression involves testing hypotheses, estimating the magnitude and direction of the relationship, and assessing the fit and predictive power of the regression model.
"
The correct answer is option A.
"
Inference for regression involves testing hypotheses, estimating the magnitude and direction of the relationship, and assessing the fit and predictive power of the regression model.
"
Inference for regression involves testing hypotheses, estimating the magnitude and direction of the relationship, and assessing the fit and predictive power of the regression model.
"
The correct answer is option A.
"
Inference for regression involves testing hypotheses, estimating the magnitude and direction of the relationship, and assessing the fit and predictive power of the regression model.
"
Soru 4
Which of the following is not a step that we have to follow while conducting a hypothesis test?
Seçenekler
A
Computing the impulse response functions
B
Formulating the null hypothesis and the alternative hypothesis
C
Selecting significance level
D
Computing the value of the test statistic
E
Comparing the computed test statistic with the critical value
Açıklama:
"
The general procedure for conducting a hypothesis test includes the following steps:
i. Formulate the null hypothesis (H0) and the alternative hypothesis (H1) based on the research question or problem being investigated.
ii. Select a significance level (α) that represents the maximum probability of making a Type I error. Common values for α include 0.05 and 0.01.
iii. Compute the value of the t-test statistic using the sample data, tβˆj.
iv. Determine the critical value (CV) at the chosen level of significance and the sample size. For one-sided test CV is tα.n-k-1, for two-sided test CV is tα/2.n-k-1
Compare the computed t-value with the critical value.
vi. Interpret the results in the context of the research question or problem being investigated. This includes summarizing the e
The correct answer is option A.
"
The general procedure for conducting a hypothesis test includes the following steps:
i. Formulate the null hypothesis (H0) and the alternative hypothesis (H1) based on the research question or problem being investigated.
ii. Select a significance level (α) that represents the maximum probability of making a Type I error. Common values for α include 0.05 and 0.01.
iii. Compute the value of the t-test statistic using the sample data, tβˆj.
iv. Determine the critical value (CV) at the chosen level of significance and the sample size. For one-sided test CV is tα.n-k-1, for two-sided test CV is tα/2.n-k-1
Compare the computed t-value with the critical value.
vi. Interpret the results in the context of the research question or problem being investigated. This includes summarizing the evidence against the null hypothesis and making conclusions about the population parameter of interest.
"
The general procedure for conducting a hypothesis test includes the following steps:
i. Formulate the null hypothesis (H0) and the alternative hypothesis (H1) based on the research question or problem being investigated.
ii. Select a significance level (α) that represents the maximum probability of making a Type I error. Common values for α include 0.05 and 0.01.
iii. Compute the value of the t-test statistic using the sample data, tβˆj.
iv. Determine the critical value (CV) at the chosen level of significance and the sample size. For one-sided test CV is tα.n-k-1, for two-sided test CV is tα/2.n-k-1
Compare the computed t-value with the critical value.
vi. Interpret the results in the context of the research question or problem being investigated. This includes summarizing the e
The correct answer is option A.
"
The general procedure for conducting a hypothesis test includes the following steps:
i. Formulate the null hypothesis (H0) and the alternative hypothesis (H1) based on the research question or problem being investigated.
ii. Select a significance level (α) that represents the maximum probability of making a Type I error. Common values for α include 0.05 and 0.01.
iii. Compute the value of the t-test statistic using the sample data, tβˆj.
iv. Determine the critical value (CV) at the chosen level of significance and the sample size. For one-sided test CV is tα.n-k-1, for two-sided test CV is tα/2.n-k-1
Compare the computed t-value with the critical value.
vi. Interpret the results in the context of the research question or problem being investigated. This includes summarizing the evidence against the null hypothesis and making conclusions about the population parameter of interest.
"
Soru 5
Which of the following theorem constitutes the logical basis of hypothesis testing using t and z statistics?
Seçenekler
A
Central limit theorem
B
Mann-Wald theorem
C
Taylor theorem
D
Cramér-Wold theorem
E
Wold’s decomposition theorem
Açıklama:
"
We need to remember the Central Limit Theorem in the use of t and z statistics!
"
The correct answer is option A.
"
We need to remember the Central Limit Theorem in the use of t and z statistics!
"
We need to remember the Central Limit Theorem in the use of t and z statistics!
"
The correct answer is option A.
"
We need to remember the Central Limit Theorem in the use of t and z statistics!
"
Soru 6
Which statistical test is based on the ANOVA framework?
Seçenekler
A
F-test
B
t-test
C
Chi-square test
D
Z- test
E
Paired t-test
Açıklama:
"
The F -test, based on the analysis of variance (ANOVA) framework, provides a statistical approach to assess whether the independent variables collectively have a significant impact on the dependent variable.
"
The correct answer is option A.
"
The F -test, based on the analysis of variance (ANOVA) framework, provides a statistical approach to assess whether the independent variables collectively have a significant impact on the dependent variable.
"
The F -test, based on the analysis of variance (ANOVA) framework, provides a statistical approach to assess whether the independent variables collectively have a significant impact on the dependent variable.
"
The correct answer is option A.
"
The F -test, based on the analysis of variance (ANOVA) framework, provides a statistical approach to assess whether the independent variables collectively have a significant impact on the dependent variable.
"
Soru 7
Which statistical test is designed to assess whether the independent variables collectively have a significant impact on the dependent variable?
Seçenekler
A
F-test
B
t-test
C
Paired t-test
D
Z- test
E
Chi-square test
Açıklama:
The correct answer is option A.
"
The F -test, based on the analysis of variance (ANOVA) framework, provides a statistical approach to assess whether the independent variables collectively have a significant impact on the dependent variable.
"
"
The F -test, based on the analysis of variance (ANOVA) framework, provides a statistical approach to assess whether the independent variables collectively have a significant impact on the dependent variable.
"
Soru 8
……. is intended for testing joint significance, while …….. is more appropriate for testing individual variables.
Which of the following completes the sentence above?
Which of the following completes the sentence above?
Seçenekler
A
F statistic and t statistic
B
T statistic and F statistic
C
Z statistic and F statistic
D
Z statistic and Chi-square statistic
E
t statistic and Chi-square statistic
Açıklama:
The correct answer is option A.
"
The F-statistic is intended for testing joint significance, while the t-statistic is more appropriate for testing individual variables.
"
"
The F-statistic is intended for testing joint significance, while the t-statistic is more appropriate for testing individual variables.
"
Soru 9
In a regression analysis, which distribution best characterizes the unobserved error term?
Seçenekler
A
Normal distribution with a mean zero and constant variance
B
Exponential distribution with a mean zero and constant variance
C
Uniform distribution with a mean zero and constant variance
D
Poisson distribution with a mean zero and constant variance
E
Binomial distribution with a mean of zero and constant variance
Açıklama:
"Normality Assumption: The population error is independent explanatory variables, X1, X2, ..., Xk and is normally distributed with zero mean and constant variance σ2, u ~ N(0, σ2).
"
The correct answer is option A.
"
Normality Assumption: The population error is independent explanatory variables, X1, X2, ..., Xk and is normally distributed with zero mean and constant variance σ2, u ~ N(0, σ2).
"
"
The correct answer is option A.
"
Normality Assumption: The population error is independent explanatory variables, X1, X2, ..., Xk and is normally distributed with zero mean and constant variance σ2, u ~ N(0, σ2).
"
Soru 10
A higher R-squared value is typically associated with a larger ………. .
Which of the following completes the sentence above?
Which of the following completes the sentence above?
Seçenekler
A
F-statistic
B
t-statistic
C
Chi-square statistic
D
Standard error
E
Variance
Açıklama:
The correct answer is option A.
"
There is a positive relationship between R-squared and the F-statistic. A higher R-squared value indicates a better fit of the regression model, which is typically associated with a larger F-statistic and a more significant overall model.
"
"
There is a positive relationship between R-squared and the F-statistic. A higher R-squared value indicates a better fit of the regression model, which is typically associated with a larger F-statistic and a more significant overall model.
"
Ünite 5
Soru 1
How is data carrying qualitative information incorporated into linear regression analysis?
Seçenekler
A
Using dummy variables
B
Using data normalization
C
Using log transformation
D
Using data smoothing
E
Using square root transformations
Açıklama:
The correct answer is option A.
"Data carrying qualitative information can be incorporated into linear regression model by using dummy variables. "
"Data carrying qualitative information can be incorporated into linear regression model by using dummy variables. "
Soru 2
Which of the following best describes the distribution of error terms in the linear probability model ?
Seçenekler
A
Binomial Distribution
B
Normal Distribution
C
Poisson Distribution
D
Exponential Distribution
E
Chi-square Distribution
Açıklama:
The correct answer is option A.
Another important point is that the distribution
of the dependent variable, which takes only two
values, conforms to the binomial distribution. This means that the distribution of the error terms
becomes a binomial distribution.
Another important point is that the distribution
of the dependent variable, which takes only two
values, conforms to the binomial distribution. This means that the distribution of the error terms
becomes a binomial distribution.
Soru 3
In which of the following models, are qualitative variables used as dependent variables?
Seçenekler
A
The linear probability model
B
The linear regression model
C
The multiple regression model
D
The autoregressive model
E
The moving-average model
Açıklama:
The correct answer is option A.
"Linear Probability Model is a model in which qualitative variables are used as dependent variables"
"Linear Probability Model is a model in which qualitative variables are used as dependent variables"
Soru 4
Which of the following statements reflects the general rule to avoid the dummy variables trap in regression analysis?
Seçenekler
A
If a qualitative variable represents n states, n-1 dummy variables should be used
B
If a qualitative variable represents n states, n dummy variables should be used.
C
If a qualitative variable represents n states, n+1 dummy variables should be used.
D
If a qualitative variable represents n states, n/2 dummy variables should be used.
E
If a qualitative variable represents n states, n+1/2 dummy variables should be used
Açıklama:
The correct answer is option A.
"To avoid dummy variables trap, as a general rule, if a qualitative variable represents n states, n-1 dummy variables should be used in the regression model."
"To avoid dummy variables trap, as a general rule, if a qualitative variable represents n states, n-1 dummy variables should be used in the regression model."
Soru 5
If all dummy variables were added to the model without excluding one of the dummy variables, …….
Which of the following completes the sentence above?
Which of the following completes the sentence above?
Seçenekler
A
a “Perfect Multicollinearity” problem would arise
B
an “Heteroscedasticity” problem would arise
C
an “Autocorrelation” problem would arise
D
an “overidentification” problem would arise
E
a “spurious regression” problem would arise
Açıklama:
The correct answer is option A.
"If all dummy variables were added to the model without excluding one of the dummy variables, a “Perfect Multicollinearity” problem would arise"
"If all dummy variables were added to the model without excluding one of the dummy variables, a “Perfect Multicollinearity” problem would arise"
Soru 6
Regression coefficients would not be calculated in the presence of ………………. ?
Which of the following fills in the blank?
Which of the following fills in the blank?
Seçenekler
A
Dummy variable trap
B
Imperfect multicollinearity
C
Autocorrelation
D
Heteroscedasticity
E
Invalid instruments
Açıklama:
The correct answer is option A.
"
If all dummy variables were added to the model without excluding one of the dummy variables, a “Perfect Multicollinearity” problem would arise and the β coeficients would not be calculated. This situation is called Dummy Variable Trap.
"
"
If all dummy variables were added to the model without excluding one of the dummy variables, a “Perfect Multicollinearity” problem would arise and the β coeficients would not be calculated. This situation is called Dummy Variable Trap.
"
Soru 7
Which of the following is not a quantitative variable?
Seçenekler
A
Gender
B
Consumption
C
Investment expenditure
D
Unit production cost
E
Wages
Açıklama:
The correct answer is option A.
"For example, consumption, wage, investment expenditure, unit production cost, exam grade, weight and age are quantitative variables. he numerical values taken by these variables give direct information about the structure and the nature of the variable. However, it is not easy to quantify variables such as gender or race."
"For example, consumption, wage, investment expenditure, unit production cost, exam grade, weight and age are quantitative variables. he numerical values taken by these variables give direct information about the structure and the nature of the variable. However, it is not easy to quantify variables such as gender or race."
Soru 8
Which of the following is not a qualitative variable ?
Seçenekler
A
GDP
B
Gender
C
Race
D
Ethnicity
E
Education Level
Açıklama:
The correct answer is option A.
"GDP is a quantitative variable, but the other variables presented in other options are qualitative variables."
"GDP is a quantitative variable, but the other variables presented in other options are qualitative variables."
Soru 9
Which of the following can be the value of a dummy variable?
Seçenekler
A
0
B
10
C
20
D
30
E
40
Açıklama:
The correct answer is option A.
"
dummy variables are defined as binary variables each of which takes the value of either 0 or 1
"
"
dummy variables are defined as binary variables each of which takes the value of either 0 or 1
"
Soru 10
- taking on binary values
- taking on numeric values
- capturing the qualitative nature of the data
Seçenekler
A
I and III
B
I,II,III
C
Only II
D
Only III
E
I and II
Açıklama:
The correct answer is option A.
The dummy variables does not take a numeric values; it only takes a binary value- 0 and 1.
Moreover, it captures qualitative nature of the data, at the same time.
The dummy variables does not take a numeric values; it only takes a binary value- 0 and 1.
Moreover, it captures qualitative nature of the data, at the same time.
Ünite 6
Soru 1
Which of the following methods is used to estimate the Tobit models?
Seçenekler
A
Maximum Likelihood
B
Ordinary Least Squares
C
Generalized Least Squares
D
Method of Moments
E
Generalized Method of Moments
Açıklama:
"Similar to Logit and Probit models, Tobit models are also estimated with maximum likelihood estimation."
The correct answers is option A.
"Similar to Logit and Probit models, Tobit models are also estimated with maximum likelihood estimation.
"
The correct answers is option A.
"Similar to Logit and Probit models, Tobit models are also estimated with maximum likelihood estimation.
"
Soru 2
Which of the following methods is used to estimate the Logit models?
Seçenekler
A
Maximum Likelihood
B
Method of Moments
C
Generalized Method of Moments
D
Generalized Least Squares
E
Ordinary Least Squares
Açıklama:
The correct answer is option A.
"Maximum Likelihood estimation is necessary for estimating regression models when the dependent variable is binary or has other nonlinear features, such as being observable only in the positive domain"
"Maximum Likelihood estimation is necessary for estimating regression models when the dependent variable is binary or has other nonlinear features, such as being observable only in the positive domain"
Soru 3
Which of the following methods is used to estimate the Probit models?
Seçenekler
A
Maximum Likelihood
B
Ordinary Least Squares
C
Generalized Least Squares
D
Method of Moments
E
Generalized Method of Moments
Açıklama:
The correct answer is option A.
"Maximum Likelihood estimation is necessary for estimating regression models when the dependent variable is binary or has other nonlinear features, such as being observable only in the positive domain
"
"Maximum Likelihood estimation is necessary for estimating regression models when the dependent variable is binary or has other nonlinear features, such as being observable only in the positive domain
"
Soru 4
Which of the following regression models is a class of statistical techniques especially designed for modeling and analyzing categorical dependent variables?
Seçenekler
A
Qualitative Response Regression Models
B
Simple Linear Regression Models
C
Vector Auotoregression Models
D
Autoregressive Integrated Moving Average Models
E
Polynomial Regression Models
Açıklama:
The correct answer is option A.
"
“Qualitative ResponseRegression Models”, is a class of statistical
techniques specifically designed for modeling and
analyzing qualitative or categorical dependent variables
"
"
“Qualitative ResponseRegression Models”, is a class of statistical
techniques specifically designed for modeling and
analyzing qualitative or categorical dependent variables
"
Soru 5
- Linear probability model
- Logit model
- Probit model
Seçenekler
A
I,II and III
B
I and II
C
I and III
D
II and III
E
Only III
Açıklama:
The correct answer is option A.
"For studying binary dependent variables, the following three models are used:
1. the linear probability model (LPM)
2. the logit model
3. the probit model
"
"
"For studying binary dependent variables, the following three models are used:
1. the linear probability model (LPM)
2. the logit model
3. the probit model
"
"
Soru 6
Which of the following estimation method is used for estimating regression models when the dependent variable exhibits nonlinear features or is binary?
Seçenekler
A
Maximum Likelihood Estimation
B
Ordinary Least Square Estimation
C
Bayesian Estimation
D
Method of Moments Estimation
E
Generalized Ordinary Least Square Estimation
Açıklama:
The correct answer is option A.
"Maximum Likelihood estimation is necessary for estimating regression models when the dependent variable is binary or has other nonlinear features, such as being observable only in the positive domain.
"
"Maximum Likelihood estimation is necessary for estimating regression models when the dependent variable is binary or has other nonlinear features, such as being observable only in the positive domain.
"
Soru 7
Which distribution does the Wald statistic follow?
Seçenekler
A
Chi-square distribution
B
Normal distribution
C
Multivariate normal distribution
D
Beta distribution
E
Logistic distribution
Açıklama:
The correct answer is option A.
"the Wald statistic is distributed with chi-square distribution with q degrees of freedom.
"
"the Wald statistic is distributed with chi-square distribution with q degrees of freedom.
"
Soru 8
Which distribution does the LR statistic follow?
Seçenekler
A
Chi-square distribution
B
Normal distribution
C
Multivariate normal distribution
D
Beta distribution
E
Logistic distribution
Açıklama:
The correct answer is option A.
"The LR test statistic is distributed with chi-square distribution with q degrees of freedom.
"
"The LR test statistic is distributed with chi-square distribution with q degrees of freedom.
"
Soru 9
The estimation of ……….. model requires the latent variable having normal distribution
Which of the following fills in the blank?
Which of the following fills in the blank?
Seçenekler
A
The Tobit
B
The VAR
C
The ARCH
D
The ARMA
E
The ARDL
Açıklama:
The correct answer is option A.
"the estimation of the Tobit model requires the latent variable having normal distribution
"
"the estimation of the Tobit model requires the latent variable having normal distribution
"
Soru 10
For modelling count data, which of the following regression models is used?
Seçenekler
A
The Poisson Regression
B
The Simple Linear Regression
C
Multiple Linear Regression
D
Exponential Regression
E
Logistic Regression
Açıklama:
The correct answer is option A.
"
This type of data is modeled with Poisson regression models
"
"
This type of data is modeled with Poisson regression models
"
Ünite 7
Soru 1
What is not the criteria that a model should satisfy for empirical analysis?
Seçenekler
A
The predictions must be logically feasible.
B
Regressors should have no correlation with error term.
C
The model should be economically sensible.
D
The parameters shouldn’t be constant.
E
Residuals should display random characteristics.
Açıklama:
Demonstrate parameter constancy; this refers to the stability of parameter values. Without parameter constancy, forecasting becomes challenging.
Soru 2
The error term in the model is stated as: “u2i = u1i + β3 X3i”. In this model, which specification error occurs?
Seçenekler
A
Omission of relevant variable.
B
Including unnecessary variable.
C
Errors of measurement.
D
Adoption of wrong functional form.
E
Incorrect specification of the stochastic error term.
Açıklama:
In this error term of the model, This error occurs due to the omission of a relevant variable X3i.
Soru 3
Which problem is created when the model includes an unnecessary variable?
Seçenekler
A
It can introduce bias in the OLS estimator.
B
It leads to overfitting of the model.
C
OLS estimator will be inconsistent.
D
It leads to nonlinearity problem.
E
It can create multiple regression model.
Açıklama:
When a researcher includes an irrelevant variable, it leads to overfitting of the model.
Soru 4
Which one is the sample of quadratic function model?
Seçenekler
A
Yi = β0 + β1 Xi + β2 Xi2+ ui.
B
Yi = β0 + β1 Xi + ui.
C
Yi = β0 + β1 Xi + β2 Xi2+ Xi3 + ui
D
Yi = β0 + β1 Xi + β2 Xi 2 + ... + βr Xi r +ui
E
Yi = β0 + β1 Xi + β2 Xi2+ β3Xi3 + β4Xi4+ui
Açıklama:
When the notation of β and X is 2, there is a quadratic function in the model.
Soru 5
What is the indication of “Yi = βXi ui” function?
Seçenekler
A
It is the sample of univariate regression function.
B
It is the sample of bivariate regression model with the intercept term.
C
It is the sample of univariate regression function with the intercept term.
D
It is the sample of bivariate regression model without the intercept term.
E
It is the quadratic regression model with the intercept term.
Açıklama:
This function is the example of a bivariate regression model without the intercept term.
Soru 6
What is the property of the R2 criterion?
Seçenekler
A
A lower R2 indicates a better fit.
B
R2 is defined as higher than 1.
C
R2 can’t decrease when additional variables are added to the model.
D
It contains the rate of total sum of squares to residual sum of squares.
E
More variables don’t increase R2.
Açıklama:
A higher R2 indicates a better fit. R2 necessarily falls within the range of 0 and 1. R2 can’t decrease when additional variables are added to the model. It contains the rate of residual sum of squares to the rate of total sum of squares. More variables increase R2 value. R2 can’t decrease when additional variables are added to the model.
Soru 7
What is one the differences between R2 and adjusted R2?
Seçenekler
A
Adjusted R2 penalizes the additional of more regressors.
B
R2 serves a superior measure compared to adjusted R2.
C
R2 is introduced to counterbalance the act of adding regressors solely to boost the adjusted R2 value.
D
The value of dependent variable must be higher in the R2 compared to adjusted R2.
E
The value of R2 is higher than value of adjusted R2.
Açıklama:
Adjusted R2 penalizes the additional of more regressors. Adjusted R2 serves a superior measure compared to R2. Adjusted R2 is introduced to counterbalance the act of adding regressors solely to boost the R2 value. The value of dependent variable must be same in the value of these two ones. The value of R2 is lower than the value of adjusted R2 or equals to the value of adjusted R2.
Soru 8
What is not the property of cross-validated (CV) estimate of variance?
Seçenekler
A
It aims to provide a more robust and accurate estimate of the model’s error compared to traditional methods.
B
To obtain the CV estimate of variance, the residuals are computed for each fold of the CV process.
C
The residuals in the CV process capture the discrepancies between the model’s predictions and the actual observations.
D
The CV estimate of variance is calculated by taking the highest value of the squared residuals across all folds and dividing it by the degrees of freedom.
E
The CV estimate of variance provides a more realistic assessment of the model’s predictive accuracy.
Açıklama:
The CV estimate of variance is calculated by taking the average value of the squared residuals across all folds and dividing it by the degrees of freedom.
Soru 9
What does the skewness measure in the model?
Seçenekler
A
It provides a mathematical way to describe how much a distribution deviates
from symmetry.
from symmetry.
B
The skewness of a distribution quantifies the concentration of data in its tail, indicating the presence of outliers.
C
This measures the size of the distribution of values.
D
This shows the amount of variation or dispersion.
E
These are the highest and lowest values in a dataset or quartile.
Açıklama:
It measures the lack of symmetry of a distribution. It provides a mathematical way to describe how much a distribution deviates from symmetry.
Soru 10
What occurs in the presence of positive skewness?
Seçenekler
A
There are fewer extreme values on the higher end of the data.
B
The left tail of the distribution is extended.
C
There are lower extreme values in the first stage of the data.
D
There isn’t any extreme value in the distribution of the data.
E
The right tail of the distribution is extended.
Açıklama:
The right tail of the distribution is extended.
Ünite 8
Soru 1
- The best model is the one with the smallest residual variance.
- The lowest order lag that lacks significance is dropped from the model.
- III. The standard error of the regression is frequently utilized as an indicator to assess the model’s performance.
Seçenekler
A
Only I
B
I and II
C
I and III
D
II and III
E
Only II
Açıklama:
In application for an autoregressive model, The best model is the one with the smallest residual variance. The highest order lag that lacks significance is dropped from the model. The standard error of the regression is frequently utilized as an indicator to assess the model’s performance.
Soru 2
In which selection dimension, the probabilities of selection a model using PRESS criterion consistently remained significantly lower than those of the t-statistics?
Seçenekler
A
In dimension 6
B
In dimension 5
C
In dimension 4
D
In dimension 3
E
In dimension 1
Açıklama:
The probabilities of selecting a model with dimension 6 using the PRESS criterion consistently remained significantly lower than those of the t-statistic.
Soru 3
In the using of the probability of accurately estimating p for the small sample size of 30, which criterion is favourable?
Seçenekler
A
Akaike (AIC)
B
Schwartz
C
Bias- Corrected Akaike (AICc)
D
Hannan Quinn (HQ)
E
PRESS
Açıklama:
For the small sample size of 30, AICc (Bias-Corrected Akaike) emerges as the most favourable criterion, in the use of illustrate the probability of accurately estimating p using different criteria with varying values of k.
Soru 4
Which section of 3V for big data are text, photos and videos stated in?
Seçenekler
A
Variety
B
Volume
C
Velocity
D
Verbality
E
Volatility
Açıklama:
Text, photos and videos are stated in “variety” of 3V for big data.
Soru 5
Which factor does effect econometricians to be faced with scarcity of data?
Seçenekler
A
Lacking of new opportunities
B
Competitive edge
C
Concerns about disclosing personal information in surveys.
D
Unimproved analytical capabilities
E
Real- time data disparities
Açıklama:
Concerns about disclosing personal information in surveys cause to get scarcity of data and this problem limits the analytical capabilities.
Soru 6
- Econometrics focuses more on the hypothesis testing, while machine learning is more concerned with formulating the generalization process as an exploration of potential hypotheses.
- Econometrics gathers the data to assess validity, on the other hand machine learning starts with the data and searches for patterns that fit the data.
- III. Econometrics gather the data and checks validity of the theory, on the other hand machine learning searches for the theory after gathering the data.
Seçenekler
A
Only I
B
I and II
C
II and III
D
I and III
E
I, II and III
Açıklama:
Both of the sections are correct in the difference of econometrics and machine learning.
Soru 7
According to the Prajapati, what programming languages had been used for data mining/data analysis in the past 12 months mostly before the date of the survey were done?
Seçenekler
A
R programming
B
SQL programming
C
Phyton programming
D
Java programming
E
MATLAB programming
Açıklama:
R programming languages had been used for data mining/data analysis in the past 12 months mostly before the date of the survey were done.
Soru 8
Which dimension has the conventional variance estimate selecting the model with 16% probability which is considerably worse compared to the 4% selection probabilities achieved by the t>2 rule?
Seçenekler
A
Dimension 2
B
Dimension 3
C
Dimension 4
D
Dimension 5
E
Dimension 6
Açıklama:
In dimension 5, the conventional variance estimate selects the model with 16% probability which is considerably worse compared to the 4% selection probabilities achieved by the t>2 rule.
Soru 9
Which dimension has the conventional variance estimate that proves to be inadequate with only a 47% probability of correctly estimating the true model and 21% probability of estimating in large samples?
Seçenekler
A
Dimension 2
B
Dimension 3
C
Dimension 4
D
Dimension 5
E
Dimension 6
Açıklama:
In large samples, the conventional variance estimate 2 proves to be inadequate, with only a 47% probability of correctly estimating the true model and a 21% probability of estimating a model with dimension 6.
Soru 10
In which estimation probability, there exists an intriguing tension between the model selection required to identify the true model and the model selection for forecasting?
Seçenekler
A
Probability of overestimating dimension for Akaike Information Criterion
B
Probability of overestimating dimension for Bias- Corrected Akaike Information Criterion
C
Probability of overestimating dimension for Schwarz Criterion
D
Probability of overestimating dimension for Hannan Quinn Criterion
E
Probability of overestimating dimension for Bayesian Information Criterion
Açıklama:
In the probability of overestimating dimension for Schwarz Criterion, There exists an intriguing tension between the model selection required to identify the true model and the model selection for forecasting.